This site uses cookies. By continuing to browse the ConceptDraw site you are agreeing to our Use of Site Cookies.

Basic Flowchart Symbols and Meaning

Flowcharts are the best for visually representation the business processes and the flow of a custom-order process through various departments within an organization. ConceptDraw DIAGRAM diagramming and vector drawing software extended with Flowcharts solution offers the full set of predesigned basic flowchart symbols which are gathered at two libraries: Flowchart and Flowcharts Rapid Draw. Among them are: process, terminator, decision, data, document, display, manual loop, and many other specific symbols. The meaning for each symbol offered by ConceptDraw gives the presentation about their proposed use in professional Flowcharts for business and technical processes, software algorithms, well-developed structures of web sites, Workflow diagrams, Process flow diagram and correlation in developing on-line instructional projects or business process system. Use of ready flow chart symbols in diagrams is incredibly useful - you need simply drag desired from the libraries to your document and arrange them in required order. There are a few serious alternatives to Visio for Mac, one of them is ConceptDraw DIAGRAM. It is one of the main contender with the most similar features and capabilities.
How to Build a Flowchart

Accounting Flowchart Symbols

Accounting is a well known and popular tool used for gaining full quantitative information about the finances. The accounting process includes extensive set of activities that begins with transactions and ends with closing of books. It contains all financial information for a given organization, the data about incomes, expenditures, purchases, sales, return, payroll, and many other numerical information. The excellent possibility to create great-looking Accounting Flowcharts is offered by professional ConceptDraw DIAGRAM diagramming and vector drawing software. It includes the Accounting Flowcharts solution containing wide variety of predesigned accounting flowchart symbols. All symbols are easy recognizable, commonly used, vector and professionally designed, so are capable effectively save your time and efforts when representing all stages of accounting work process, the flow of data in an organization, accounting procedures and processes, documents, tasks, responsible people, users, components and authorizations.

Technical Flow Chart

Flow chart is a diagrammatic representation of an algorithm and essential part of planning the system. Flow charts are widely used in technical analysis and programming for easy writing programs and explaining them to others. So, one of the most popular type of flow charts is Technical Flow Chart. Technical Flow Chart can be drawn by pencil on the paper, but it will be easier to use for designing a special software. ConceptDraw DIAGRAM diagramming and vector drawing software extended with Flowcharts Solution from the "Diagrams" Area of ConceptDraw Solution Park will be useful for this goal.

Data Flow Diagram Symbols. DFD Library

Data Flow Diagrams graphically represent the information transfers and process steps of a system. They visually depict how data are processed by a system in terms of inputs and outputs, how occurs the input in a system, how the data flow through an information system and where they are stored, and how occurs output from the system. DFDs give the overview of the system and models the processes aspects, they are maintained with other methods of structured systems analysis. The main goal of DFDs is achievement of understanding between developers and users. For their construction are used two notations - Gane-Sarson and Yourdon, each of them uses its own set of symbols. Data Flow Diagrams solution from Software Development area extends the ConceptDraw DIAGRAM software with templates, samples, and predesigned libraries of data flow diagram symbols for both notations, allowing you easy design the process-oriented and data-oriented models, draw the Data Flow Diagrams, Data Flowcharts, Data Process Diagrams, Information Flow Diagrams, Structured Analysis Diagrams, etc.

Process Flowchart

The main reason of using Process Flowchart or PFD is to show relations between major parts of the system. Process Flowcharts are used in process engineering and chemical industry where there is a requirement of depicting relationships between major components only and not include minor parts. Process Flowcharts for single unit or multiple units differ in their structure and implementation. ConceptDraw DIAGRAM is Professional business process mapping software for making Process flowcharts, Process flow diagram, Workflow diagram, flowcharts and technical illustrations for business documents and also comprehensive visio for mac application. Easier define and document basic work and data flows, financial, production and quality management processes to increase efficiency of your business with ConcepDraw DIAGRAM. Business process mapping software with Flowchart Maker ConceptDraw DIAGRAM includes extensive drawing tools, rich examples and templates, process flowchart symbols and shape libraries, smart connectors that allow you create the flowcharts of complex processes, process flow diagrams, procedures and information exchange. Process Flowchart Solution is project management workflow tools which is part ConceptDraw Project marketing project management software. Drawing charts, diagrams, and network layouts has long been the monopoly of Microsoft Visio, making Mac users to struggle when needing such visio alternative like visio for mac, it requires only to view features, make a minor edit to, or print a diagram or chart. Thankfully to MS Visio alternative like ConceptDraw DIAGRAM software, this is cross-platform charting and business process management tool, now visio alternative for making sort of visio diagram is not a problem anymore however many people still name it business process visio tools.
How To Create a Process Flow Chart (business process modelling techniques)

DFD Library — Design elements

Data Flow Diagrams (DFD) solution from the Software Development area of ConceptDraw Solution Park provides plenty of predesigned templates, samples and DFD vector design elements proposed by three DFD libraries. These DFD library objects are designed to help you effectively model the data flows and functional requirements for the business processes or systems, to design the Process-oriented models or Data-oriented models, Data flowcharts and Data process diagrams, Structured analysis diagrams and Information flow diagrams. There are two different notations used to draw the Data Flow Diagrams (Yourdon & Coad and Gane & Sarson). These notations define the different visual representations for the processes, data stores, data flows, and external entities. ConceptDraw DIAGRAM software provides you with possibility of designing professional-looking Data Flow Diagrams, DFD Models, Data Flow Process Diagrams using any of these notations. Simply drag the predesigned DFD flowchart symbols from the appropriate library and connect by arrows depicting the data flow from one step to another.

Piping and Instrumentation Diagram Software

Piping and Instrumentation Diagram is a technical sketch or drawing, which shows in details the piping system and instrumentation of a processing plant. Piping and Instrumentation Diagram is developed by process design engineers and technical engineers on the phase of plant design. This plan is necessary on the stages of plant construction and then is actively used by operators, instrumentation and piping engineers when operating the plant. ConceptDraw DIAGRAM software provides unique Plumbing and Piping Plans solution from Building Plans area of ConceptDraw Solution Park with 10 libraries of ready-to-use predesigned vector elements, templates and samples, to help you create professional Piping diagrams and schematics, Instrumentation diagrams, Plumbing plans and blueprints, Schemes of hot and cold water supply systems, Heating schemes, Mechanical diagrams, Diagrams of fluids, hydraulics, air and gas pipings, Technical drawings of waste water disposal systems, Schematics of industrial piping systems, Diagrams of ventilation systems, etc.

flow chart software, flowchart maker, flowchart, flow chart Flowcharts

flow chart software, flowchart maker, flowchart, flow chart
The Flowcharts solution for ConceptDraw DIAGRAM is a comprehensive set of examples and samples in several varied color themes for professionals that need to represent graphically a process. Solution value is added by the basic flow chart template and shapes' libraries of flowchart notation. ConceptDraw DIAGRAM flow chart creator lets one depict the processes of any complexity and length, as well as design the Flowchart either vertically or horizontally.

Functional Block Diagram

You need design the Functional Block Diagram and dream to find the useful tools to draw it easier, quickly and effectively? ConceptDraw DIAGRAM offers the Block Diagrams Solution from the "Diagrams" Area which will help you!

Data Flow Diagram

Data Flow Diagram (DFD) is the part of the Structured Systems Analysis and Design Methodology (SSADM), which is intended for information systems projection and analysis. Data Flow Diagrams allow graphically represent the data flows in information system and analyze the data processing during the structural projection. This type of diagrams lets visually show a work of information system and results of this work, it is often used in connection with human processes and can be displayed as Workflow diagram. Data Flow Diagram visualizes processes and functions, external entities, data depositories, and data flows connecting these elements and indicating direction and data character. Each of these elements used for DFD has its own graphical notation. There are two notations to draw DFDs - Yourdon & Coad and Gane & Sarson. ConceptDraw DIAGRAM extended with Data Flow Diagrams (DFD) solution from Software Developmant area is ideal for designing professional looking DFDs, which can be then easily exported in various formats.

Process Flow Diagram

A Process Flow Diagram (PFD) is a diagram which shows the relationships between the main components in a system. Process Flow Diagrams are widely used by engineers in chemical and process engineering, they allows to indicate the general flow of plant process streams and equipment, helps to design the petroleum refineries, petrochemical and chemical plants, natural gas processing plants, and many other industrial facilities. ConceptDraw DIAGRAM diagramming and vector drawing software extended with powerful tools of Flowcharts Solution from the "Diagrams" Area of ConceptDraw Solution Park is effective for drawing: Process Flow Diagram, Flow Process Diagram, Business Process Flow Diagrams.

Data Flow Diagram (DFD)

A Data Flow Diagram (DFD) illustrates the flow of data through an information system, visualizes how the information is handled in terms of inputs and outputs, how the data enter to system and leave it. It is effective to use a Data Flow Diagram for creation the system's overview, to show the system's scope and boundaries. There are two different types of notations for DFDs: Yourdon-Coad and Gane-Sarson, which differ in visual representations for processes, data flow, data stores, external entities, etc. Thus, for example the processes are depicted as circles in Yourdon-Coad notation and as rounded squares in Gane-Sarson notation. Gane-Sarson notation is usually used for visualization information systems and Yourdon-Coad - for system analysis and design. The Data Flow Diagrams solution included to Software Development area of ConceptDraw Solution Park offers a lot of DFD templates, samples and examples, libraries of vector stencils for construction without efforts the DFDs according to both Gane-Sarson and Yourdon-Coad notations.

Process Flow Diagram Symbols

Chemical and Process Engineering Solution from the Industrial Engineering Area of ConceptDraw Solution Park is a unique tool which contains variety of predesigned process flow diagram symbols for easy creating various Chemical and Process Flow Diagrams in ConceptDraw DIAGRAM.

systems engineering, sysml SYSML

systems engineering, sysml
The SysML solution helps to present diagrams using Systems Modeling Language; a perfect tool for system engineering.
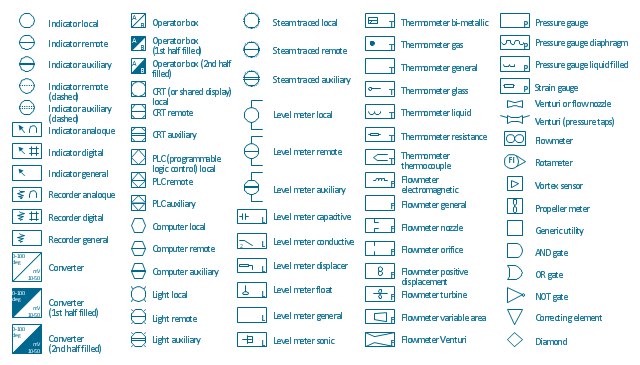
The vector stencils library "Instruments" contains 72 symbols of control instruments and measuring devices: meters and gauges, and callouts, text boxes, and inserts.
Use these shapes to create annotated process flow diagrams (PFD), flow control, manufacturing processes, and distribution system diagrams.
"Process control is an engineering discipline that deals with architectures, mechanisms and algorithms for maintaining the output of a specific process within a desired range.
Process control is extensively used in industry and enables mass production of continuous processes such as oil refining, paper manufacturing, chemicals, power plants and many other industries. Process control enables automation, with which a small staff of operating personnel can operate a complex process from a central control room." [Process control. Wikipedia]
The example "Design elements - Instruments" was created using the ConceptDraw PRO diagramming and vector drawing software extended with the Chemical and Process Engineering solution from the Engineering area of ConceptDraw Solution Park.
Process control instrument symbols
Process control instrument symbols , vortex sensor, venturi, flow nozzle, thermometer, strain gauge, pressure, steam traced, steam traced instrument, rotameter, recorder, propeller meter, pressure gauges, pressure gauge, operator box, light, level meter, indicator, discrete instrument, indicator, generic utility, flowmeter, diamond, dashed mid-line, indicator, discrete instrument, correcting element, converter, computer, computer function, PLC, programmable logic control, NOT gate, CRT, shared display, CRT,  shared display, AND gate,  recorder,

microsoft azure, windows azure, azure management, azure storage, azure blob storage, azure services Azure Architecture

microsoft azure, windows azure, azure management, azure storage, azure blob storage, azure services
Azure Architecture solution bundles into one handy tool everything you need to create effective Azure Architecture diagrams. It adds the extra value to versatile ConceptDraw DIAGRAM software and extends the users capabilities with comprehensive collection of Microsoft Azure themed graphics, logos, preset templates, wide array of predesigned vector symbols that covers the subjects such as Azure management, Azure storage, and Azure services, amongst others, and allow you to illustrate Azure Architecture diagrams at any degree of complexity, to present visually your Azure cloud system architecture with professional style, to design Azure cloud topology, to document Windows Azure Architecture and Azure Cloud System Architecture, to visualize the great abilities and work of Microsoft Azure Cloud System and Azure services.

cross-functional flowchart template, flowchart, example business process flow Cross-Functional Flowcharts

cross-functional flowchart template, flowchart, example business process flow
Cross-functional flowcharts are powerful and useful tool for visualizing and analyzing complex business processes which requires involvement of multiple people, teams or even departments. They let clearly represent a sequence of the process steps, the order of operations, relationships between processes and responsible functional units (such as departments or positions).

Flowchart Symbols Accounting. Activity-based costing (ABC) flowchart

The Accounting Flowcharts are helpful and popular kind of flowcharts in a field of business, finance and accounting. The ConceptDraw DIAGRAM diagramming software enhanced with Accounting Flowcharts solution from the Finance and Accounting area of ConceptDraw Solution Park is extremely comfortable for visually explaining the accounting processes and for designing Accounting Flowcharts and Accounting Process Flow Diagrams of any complexity. The library of vector design elements included to Accounting Flowcharts solution provides you with major accounting flowchart symbols, which make the drawing process incredibly easy and convenient. The use of them for designing of such sort of Accounting Flowcharts as the Activity-based costing (ABC) flowcharts will simplify the drawing process and will allow to make these flowcharts in a few minutes in ConceptDraw DIAGRAM. Design easily your own ABC flowcharts to demonstrate in details the relations and logics of activity-based distribution the costs between the company's units and departments.

Interior Design. Piping Plan — Design Elements

The pipe laying and setting the plumbing system at new apartment or home, or replacing the worn plumbing begins from the choice of materials, sizes of pipes and creation the plan. When developing a piping system, the engineer should take into account many aspects, such as advantages and disadvantages of different pipes materials, the temperature changes (freezing or thermal expansion) that effect on pipes. The most commonly used are steel pipes which have passed the test of time, but they are difficult for assembling and prone to corrosion, plastic (polypropylene) pipes that are characterized by low weight and price, ease of installation and durability, and also PEX-AL-PEX pipes. Numerous libraries with ready-to-use design elements of pipes, valves and other plumbing and piping equipment included to Plumbing and Piping Plans solution for ConceptDraw DIAGRAM help easy design Piping and Plumbing interior design plans, blueprints, schematic diagrams, technical drawings of waste water disposal systems, hot and cold water supply systems.

Mechanical Drawing Symbols

Mechanical Drawings are the special type of technical diagrams that visualize the structure of complex systems and illustrate the information about ventilation, heating, air conditioning, i.e. HVAC systems. These drawings are created on the base of floor plans and reflected ceiling plans, and then become an obligatory part of construction project which is needed directly for construction a building and for receiving a permit on it. Mechanical drawings and diagrams help effectively represent construction, technical and engineering solutions, and also schematics of different mechanical equipment. ConceptDraw DIAGRAM ector drawing software enhanced with Mechanical Engineering solution from Engineering area of ConceptDraw Solution Park provides wide set of effective drawing tools, predesigned mechanical drawing symbols, templates, samples and examples. Use of standardized and recognized mechanical vector symbols helps you design understandable mechanical drawings, diagrams and mechanical engineering schematics.