HelpDesk
How to Draw a Gantt Chart
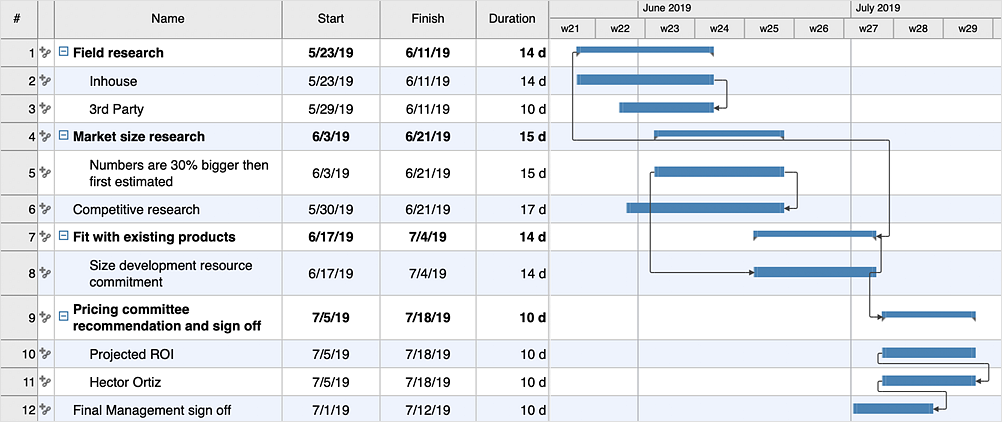
A Gantt chart is intended to provide a visualization of a project schedule. It is developed to help planning, coordinating, and tracking on project tasks implementation. One of the most critical resources for project implementation are time resources. Gantt chart - is one of the most convenient and popular ways of graphical representation of a project tasks progress in conjunction with the corresponding time consumption. Gantt chart's function is to show project tasks completed in progress and to make a project manager sure that project tasks were completed on time. ConceptDraw Office is a clear and easy-to-use tool for project management. It is a very handy visual tool that helps make a project processing clear.HelpDesk
How to Create a Gantt Chart for Your Project
Instruction on how to create Gantt chart using ConceptDraw PROJECT software. Gant Chart is a graphical representation of tasks as segments on a time scale. It helps plan or overlapping.
 Business Processes
Business Process solution extends ConceptDraw DIAGRAM software with business process diagrams as cross-functional flowcharts, workflows, process charts, IDEF0, timelines, calendars, Gantt charts, business process modeling, audit and opportunity flowcharts.
HelpDesk
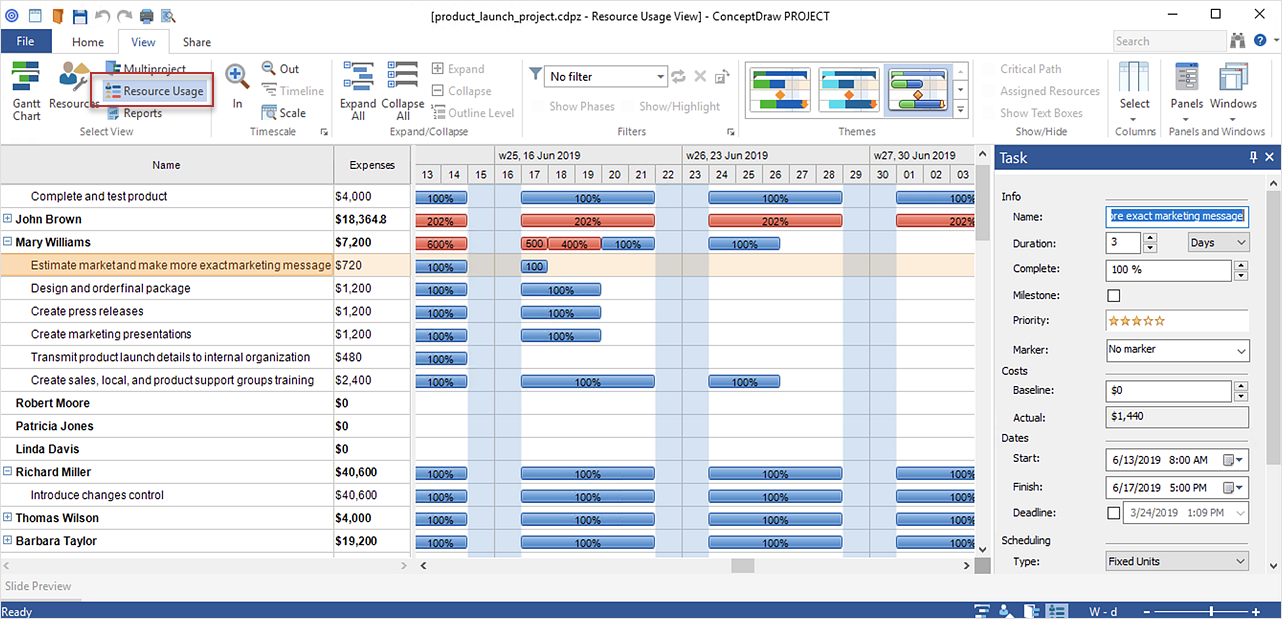
How to Plan and Allocate Resources with ConceptDraw PROJECT on PC
Effective resource management is a key factor in the successful project implementation. The common types of resources for which the project manager has an impact, include material resources (materials, energy), staff (work) and equipment. CoceptDraw PROJECT provides easy ways to project Resources Management: Create a list of project resources and assign the right human resource, as well as the necessary material, or equipment to be used.Export from ConceptDraw DIAGRAM Document to MS Visio® XML
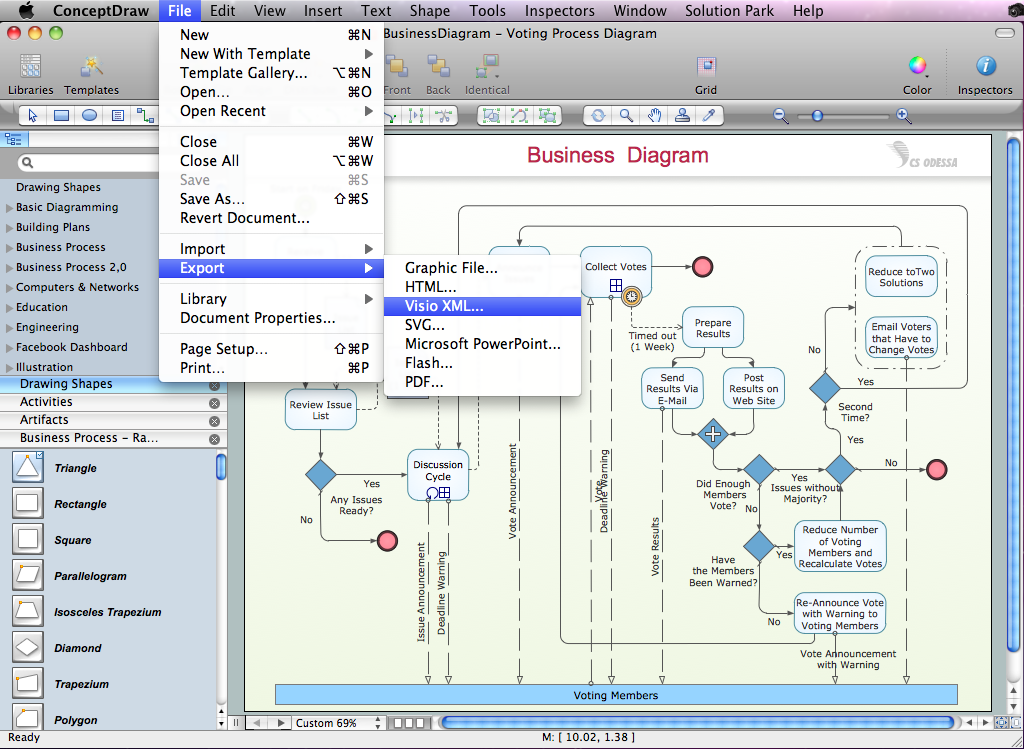
Once you have created your document in ConceptDraw DIAGRAM and you want to share it with your colleagues and friends, who uses MS Visio on their computers, you can easily export your document using ConceptDraw DIAGRAM export to Visio XML files (VDX) feature. Now you can share your ConceptDraw documents with MS Visio users.
HelpDesk
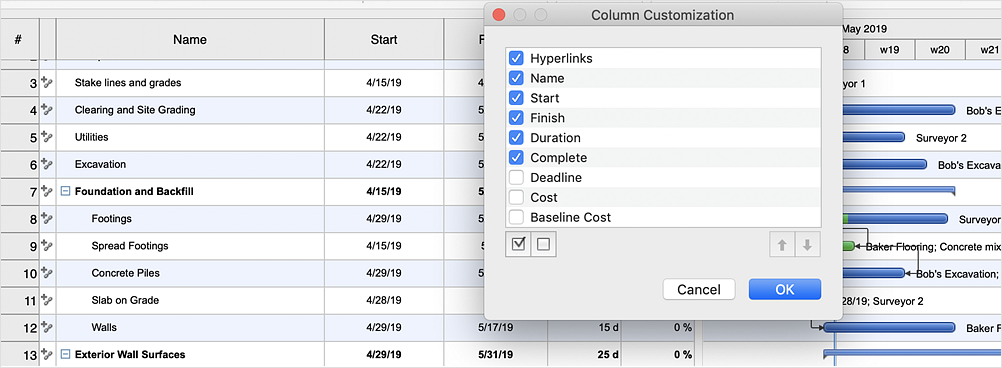
How to Customize Columns in Your Project Schedule
Some ConceptDraw PROJECT users need to start new projects from their custom default page. In this post we tell you how to make it.Business Diagram Software
When managing the projects, people, or networks, there are daily designed and used different types of Business diagrams, so the powerful drawing software will be very useful for this. ConceptDraw DIAGRAM with large quantity of business solutions will meet your needs and will help you convey your ideas successful and rapidly, no matter are you professional or beginner. It is the best choice for business specialists and technical professionals who need quickly and easily explore, visualize, and communicate information. ConceptDraw DIAGRAM business diagram software is the most powerful business software and relational charting software. Create advanced, completely customizable Business Process Diagrams, Business Flow Charts, Work Flow Diagrams, Organizational Charts, Audit diagrams, Marketing diagrams, Value Stream Maps, TQM diagrams, ERD diagrams, EPC diagrams, Cause and Effect diagrams, Infographics, Dashboards, and other Relational business diagrams from your data using the powerful drawing tools of ConceptDraw Solution Park.
HelpDesk
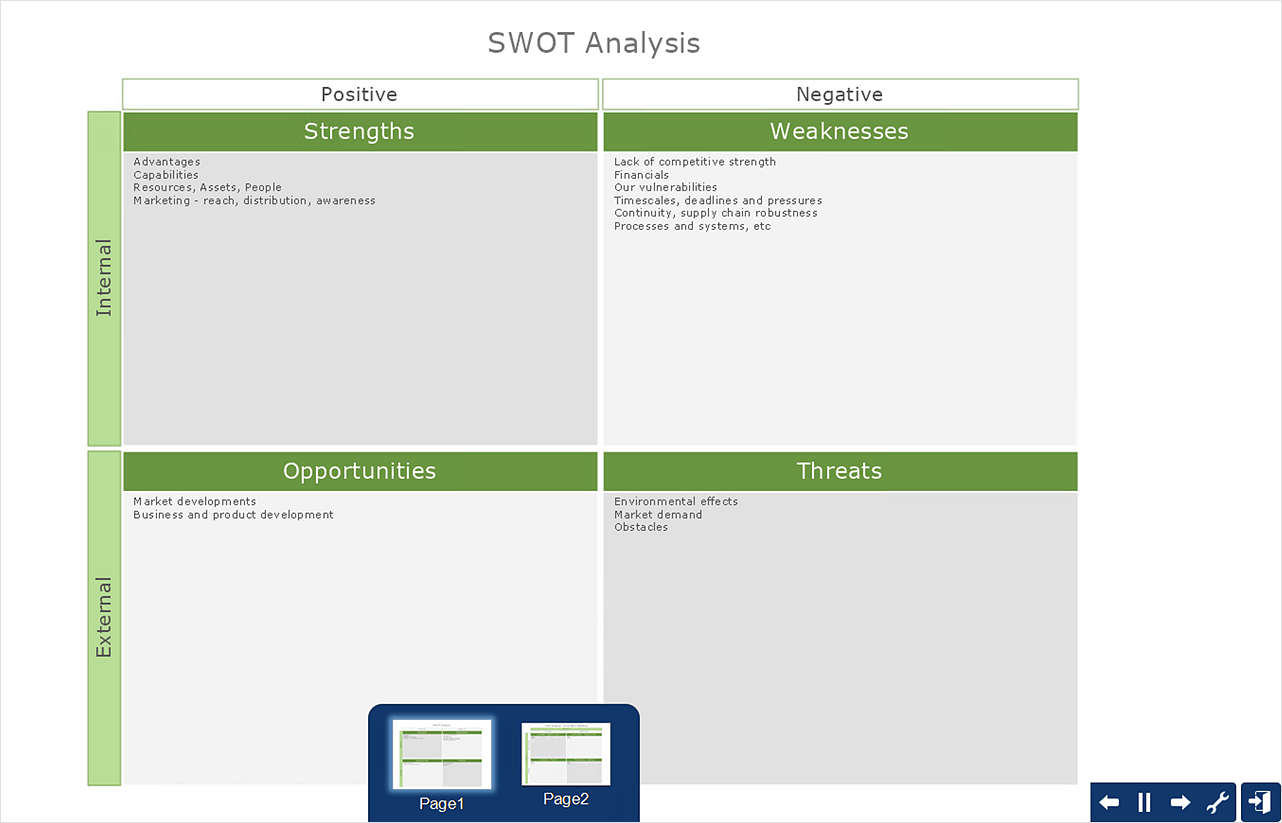
How to Create a SWOT Matrix Quickly
ConceptDraw DIAGRAM allow create SWOT Matrix in just one click for presenting analysis results preformed in mimd map structure using ConceptDraw MINDMAP.HelpDesk
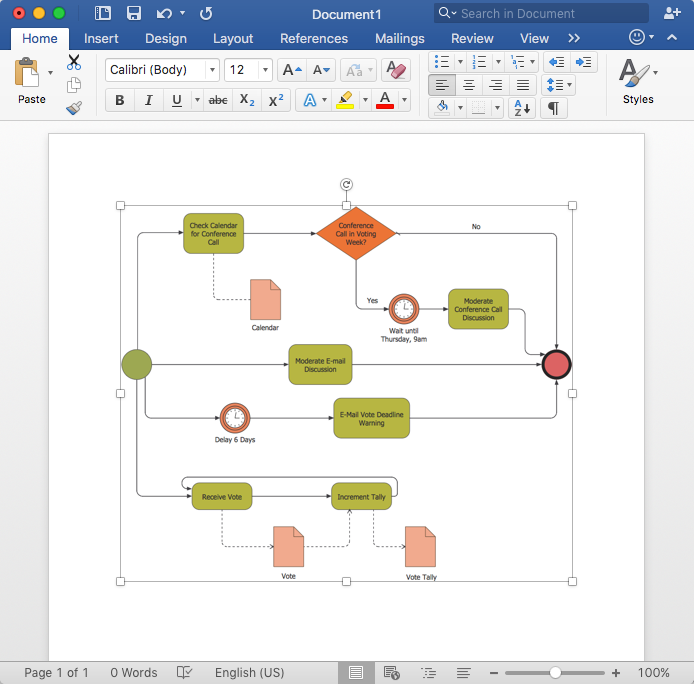
How to Add a Business Process Diagram to MS Word Document
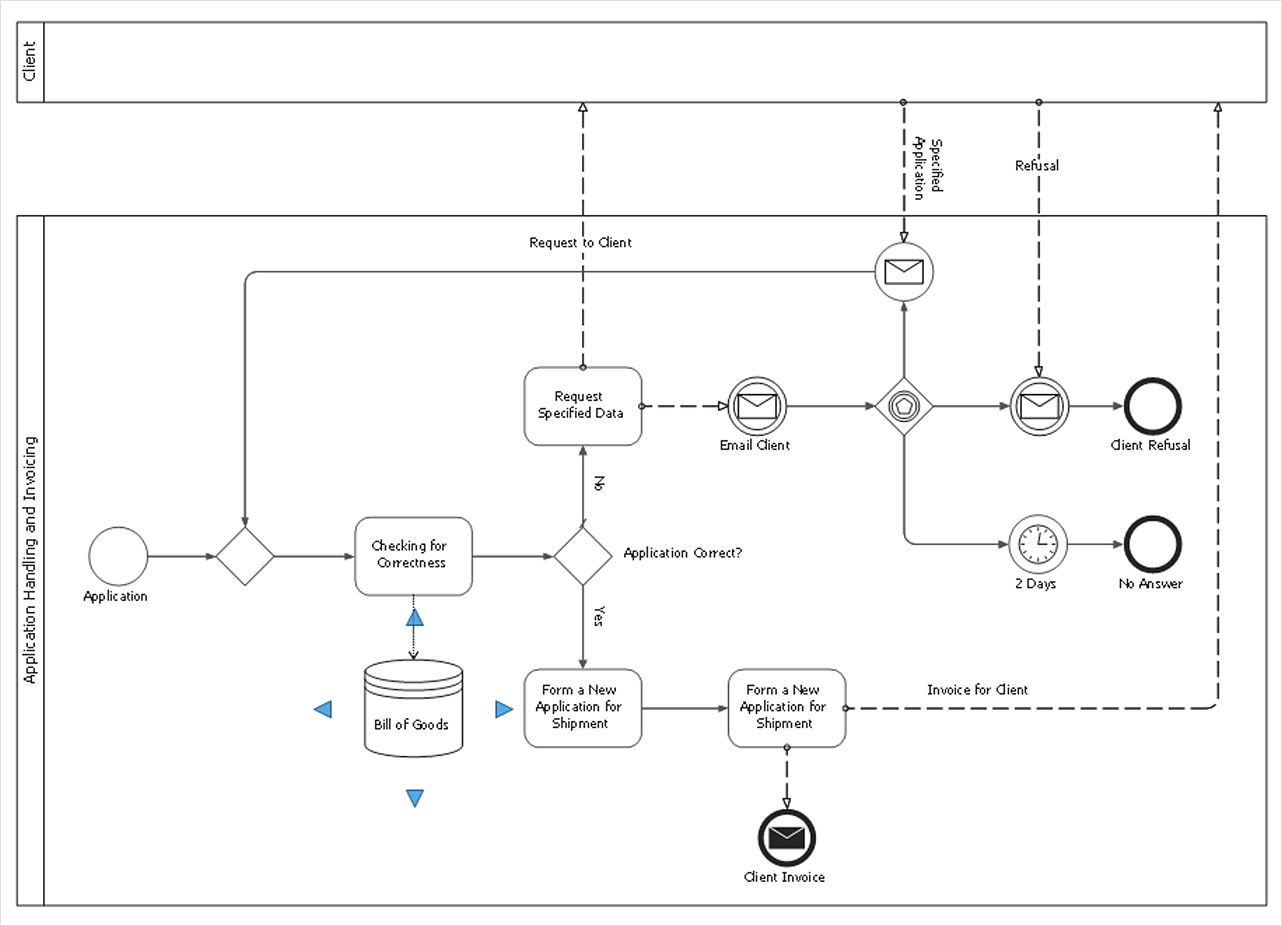
Business process diagrams are specialized types of flowcharts based on the Business Process Model and Notation. Making a business process diagram involves many different elements that can be managed using ConceptDraw DIAGRAM. The ability to design Business process diagrams is delivered by the Business Process Diagrams solution. The business process diagram may be the part of the business process management documentation that should be presented as MS Word document. In this case, the best way is using the advanced copy-and-paste functionality of ConceptDraw DIAGRAM.HelpDesk
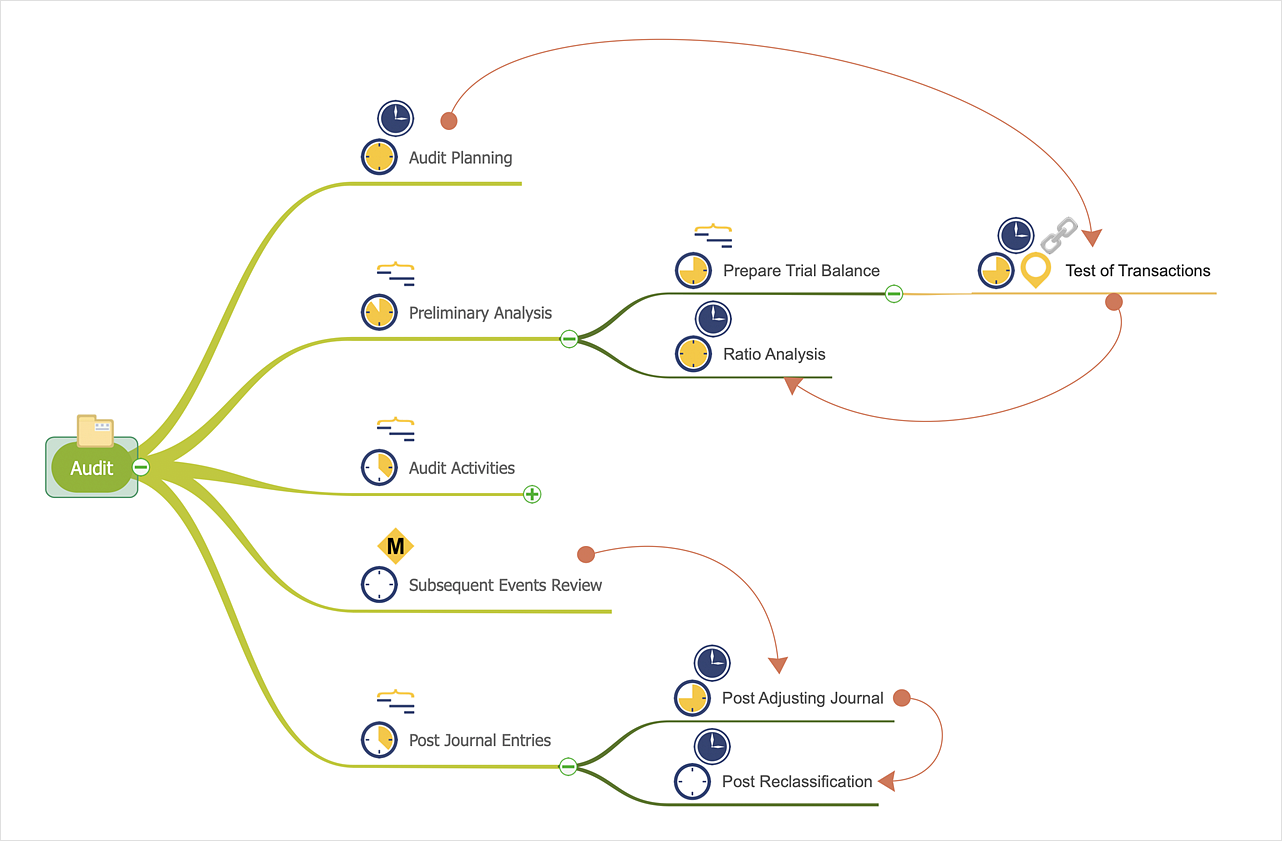
How to Make a Mind Map from a Project Gantt Chart
ConceptDraw Office allows you to see the project data from ConceptDraw PROJECT in a mind map structure by opening your project in ConceptDraw MINDMAP.HelpDesk
How to Create Project Diagrams on PC
Visual diagrams gives the ability to view at a detailed level project attributes such as project scope, logical connections in the project, critical paths, key events on the timeline, milestones, tasks, calendars for work, and resource utilization.HelpDesk
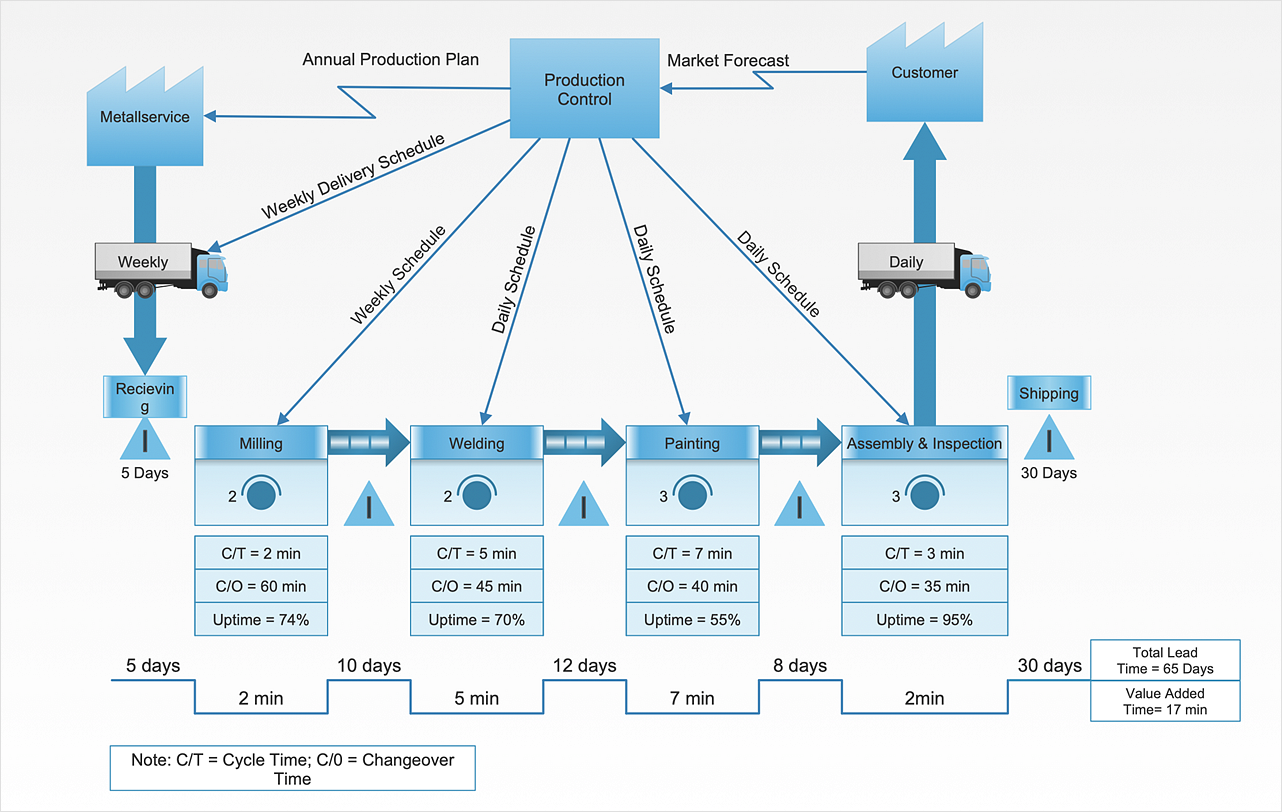
How to Create a VSM Diagram Using Solutions
Value Stream Mapping is a Lean Manufacturing tool that uses a flow diagram to document in great detail every step of a manufacturing process. This graphical representation of a process is a powerful tool that helps in the diagnosis of process efficiency and allows companies to develop improved processes. Many lean practitioners use Value Stream Mapping as a fundamental tool to identify waste, cut process cycle times, and implement process improvement. Many organizations use value stream mapping as a key portion of their lean efforts. Value Stream Maps are used to analyze and design the flow of materials and information required to bring a product or service to a consumer. You can create a Value Stream Mapping flowchart using ConceptDraw DIAGRAM tools.HelpDesk
What Information to be Displayed in the ConceptDraw PROJECT Gantt Chart View
What information can contain the project task list? Gantt Chart view is a graphical representation of a project outline that allows one to allocate tasks. You can customize a project’s tasks list view to include the columns you need to meet your information requirements. The columns of the ConceptDraw PROJECT Gantt view contain the information you want to capture about each task in your project. The following article details what information can be contained in the columns of a project outline:<Business Processes
The most worked out and commonly used methodology of business processes description is IDEF methodology. Besides business processes it allows to describe functional blocks, for example production and marketing. ConceptDraw lets creation of business processes description using IDEF0 and IDEF2 methods.HelpDesk
How to Develop a Business Process Model
Making a Business Process diagram involves many different elements that can be managed using ConceptDraw DIAGRAM. The ability to design Business Process diagrams is delivered by the Business Process Diagrams solution.- The Garden Service Business Gantt Chart
- Gantt Chart Of A Catering Business
- Garden Gantt Chart
- Example For Effective Utilisation Of Material In Flow Process Chart
- Process Flowchart | Business Processes description with ...
- Flow chart Example . Warehouse Flowchart | Material Requisition ...
- Help Desk Service
- Construction Project Chart Examples | Gant Chart in Project ...
- Project —Task Trees and Dependencies | Project — Working With ...
- How To Create Restaurant Floor Plan in Minutes | Gant Chart in ...
- Bar Chart Of Building Construction Home
- Chore charts with ConceptDraw PRO | Chore chart - Template ...
- How to Draw a Floor Plan for Your Office | How To Draw Building ...
- Process Flowchart | Human Resource Development | | Schematic ...
- Flowcharts | Top 5 Android Flow Chart Apps | Basic Audit Flowchart ...
- How to Create a Timeline Diagram in ConceptDraw PRO | Design ...
- Business Processing Modeling Notation Parking
- Process decision program chart (PDPC) - Personal activity | Physical ...
- New business opportunity SWOT analysis matrix - Template ...

