 Sales Flowcharts
The Sales Flowcharts solution lets you create and display sales process maps, sales process workflows, sales steps, the sales process, and anything else involving sales process management.
 Business Process Diagrams
Business Process Diagrams solution extends the ConceptDraw PRO BPM software with RapidDraw interface, templates, samples and numerous libraries based on the BPMN 1.2 and BPMN 2.0 standards, which give you the possibility to visualize equally easy simple and complex processes, to design business models, to quickly develop and document in details any business processes on the stages of project’s planning and implementation.
 Fishbone Diagrams
The Fishbone Diagrams solution extends ConceptDraw PRO v10 software with the ability to easily draw the Fishbone Diagrams (Ishikawa Diagrams) to clearly see the cause and effect analysis and also problem solving. The vector graphic diagrams produced using this solution can be used in whitepapers, presentations, datasheets, posters, and published technical material.
HelpDesk
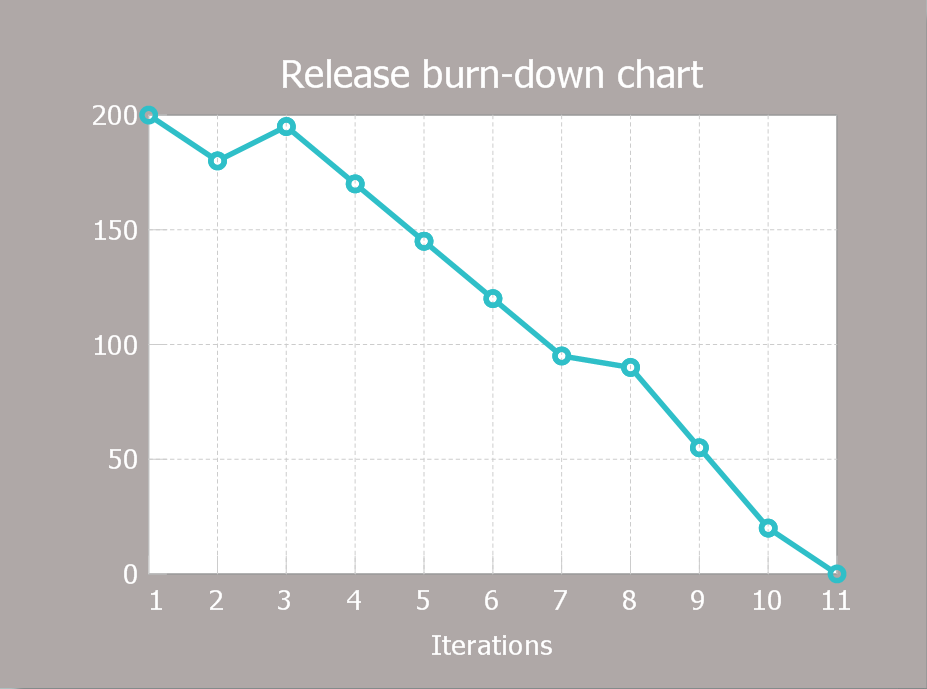
How to Create a Release Burn-Down Chart Using ConceptDraw PRO
The Agile methodology provides project teams the ability to quickly adapt the project to the current situation and thus achieve maximum productivity. According the Scrum method the steps needed to fulfill the project goal breaks down by using short sprints or iterations. The iterations together with an extensive collaboration can increase productivity by better understanding the entire flow of a project. A release burn-down chart is used to track a progress on a Scrum project. The ConceptDraw Scrum Workflow Solution makes it easy for Agile project team to build any professional Scrum diagram such as a Release velocity chart, Release burn-down chart, Sprint burn-down chart, or a Team velocity chart.
 Basic Line Graphs
This solution extends the capabilities of ConceptDraw PRO v10.3.0 (or later) with templates, samples and a library of vector stencils for drawing Line Graphs.
- Sales And Marketing Process Flow Chart
- Sales Growth . Bar Graphs Example | Sales Process Flowchart ...
- Sales Charts
- Marketing and Sales Organization chart . Organization chart Example
- Sales Growth . Bar Graphs Example | Chart Maker for Presentations ...
- Diagram Sale
- Marketing and Sales Organization chart . Organization chart ...
- Sales Process Flowchart. Flowchart Examples | Sales Dashboard ...
- Sales Growth . Bar Graphs Example | Sales Dashboards for Your ...
- Blank Organisational Chart
- How to Draw an Organization Chart | Examples of Flowcharts, Org ...
- Organizational Chart Sample Of Coffee Shop
- Bar Graphs | Sales Growth . Bar Graphs Example | Bar Chart ...
- Blank Organizational Chart Template
- Block diagram - Selling technology patent process | Sales Process ...
- Marketing mix - Wheel diagram | Target diagrams - Vector stencils ...
- Design elements - Marketing charts | Marketing Organization Chart ...
- Process Flowchart | Flow chart Example. Warehouse Flowchart ...
- Sales Growth . Bar Graphs Example | Bar Chart Examples | Bar ...
- Organizational Charts | How to Use ConceptDraw Sales Dashboard ...
