HelpDesk
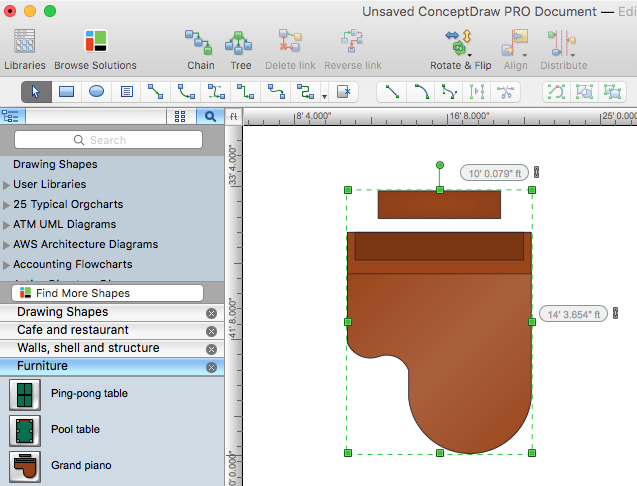
How to Change Measurement Units in ConceptDraw Drawing
ConceptDraw PRO allows you to work with drawings with many different measurement units."At the base of the identity of an organisational is its organizational culture. A culture is comprised of the shared values, customs, traditions, rituals, behaviours and beliefs shared by a social group (national, ethnic, organizational, etc.). Cultures also share languages, or ways of speaking. From a communication perspective, cultures are made and remade through the words we use to describe our world. Culture represents a common set of values (“shared meanings”), shared by members of a population, a organization, a project/ programme purpose unit or a profession (e.g., engineers versus scientists). Culture change with the times but the speed at which the culture of different institutions change varies widely." [Development Cooperation Handbook/ The development aid organization/ Organizational Culture. Wikibooks]
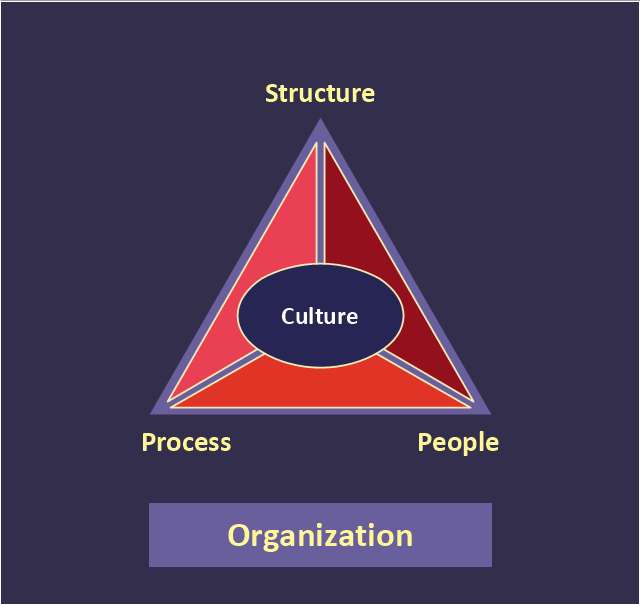
This organizational culture triangle diagram example derived from Parker and Benson's model. It's for explaination of the Regatta: Adoption Method.
The pyramid diagram example "Organizational culture" was redesigned using the ConceptDraw PRO diagramming and vector drawing software from Wikimedia Commons file Organization_ Triangle.png. [commons.wikimedia.org/ wiki/ File:Organization_ Triangle.png]
This file is licensed under the Creative Commons Attribution-Share Alike 2.5 Generic license. [creativecommons.org/ licenses/ by-sa/ 2.5/ deed.en]
The triangular chart sample "Organizational culture" is included in the Pyramid Diagrams solution from the Marketing area of ConceptDraw Solution Park.
HelpDesk
Event-driven Process Chain (EPC) Diagram Software
An EPC diagram is a type of flowchart used in business process analysis. It shows different business processes through various work flows. The workflows are shown as processes and events that are related to different executes and tasks that allow business workflow to be completed. An EPC diagram shows different business processes through various workflows. The workflows are seen as functions and events that are connected by different teams or people, as well as tasks that allow business processes to be executed. The best thing about this type of enterprise modelling is that creating an EPC diagram is quick and simple as long as you have the proper tool. One of the main usages of the EPC diagrams is in the modelling, analyzing and re-engineering of business processes. With the use of the flowchart, businesses are able to see inefficiencies in the processes and modify to make them more productive. Event-driven process chain diagrams are also used to configure an enterprise resource plaIDEF3 Standard
Use Case Diagrams technology. IDEF3 Standard is intended for description and further analysis of technological processes of an enterprise. Using IDEF3 standard it is possible to examine and model scenarios of technological processes.- Draw An Organisational Development Diagram And Relate The ...
- Organizational Development Importance Diagram
- Www Diagram Of Organisational Development
- Concept Diagram Of Organizational Development
- Diagram Of Organisational Development
- Diagram And Flow Chart Of Organization Development Skills
- System Organisation Design Using Dfd
- Daigram Of Various Component Or Unit Of Information Technology
- Organization Chart Templates | Organizational culture - Triangle ...
- Human Resource Development | Organizational Structure Types ...
- Strategic planning - Cycle diagram | Successful Strategic Plan ...
- 4 Level pyramid model diagram - Information systems types | 5 Level ...
- Organizational Structure | Active Directory Domain Services diagram ...
- Diagram Of Communication Flow In An Organisation
- How to Draw an Organization Chart | Examples of Flowcharts, Org ...
- Pyramid Diagram | Process Flowchart | Organizational culture ...
- How to Draw an Organization Chart | Organizational Structure ...
- Organizational culture - Triangle diagram | Pyramid Diagram | Matrix ...
- Process Flowchart | Pyramid Diagram | Matrix Organization Structure ...
- Block diagram - Types of individual behavior in organization ...


