This site uses cookies. By continuing to browse the ConceptDraw site you are agreeing to our Use of Site Cookies.

Mind Maps for Business - SWOT Analysis

SWOT analysis is a planning method and the best way for effective exploring four major aspects for a business or a venture - strengths, weaknesses, opportunities and threats. Visually SWOT analysis results are depicted as a SWOT matrix, diagram or Mind Map, which is then included to the set of documents, report or in presentation devoted to demonstration the results of realized SWOT analysis for directors, shareholders, and other interested employees. ConceptDraw Solution Park includes the SWOT and TOWS Matrix Diagrams solution, which offers wide possibilities for realization SWOT analysis and creation SWOT Matrices and SWOT Mind Maps in ConceptDraw DIAGRAM and ConceptDraw MINDMAP software. This solution includes fully ready-to-use SWOT vector design elements, SWOT matrix samples and also useful templates that allow users create own SWOT diagrams and Mind Maps for business SWOT analysis in a few minutes. Use also the perfect ability of instantly exporting to various formats and of creation MS PowerPoint presentation right from the ConceptDraw applications.

Quality Mind Maps - samples and templates

Use samples and templates to describe your own quality processes, brainstorm, and structure quality issues.
HelpDesk

How To Create Root Cause Analysis Diagram Using Solutions

Root Cause Analysis (RCA) is used to determine the main causes of the problem. If the certain factor is the root cause, this mean that its vanishing will help to prevent the further recurrence of the problem. Root Cause Analysis diagram is used to analyze the root causes of factors that influence the problem. It helps to identify the root causes for a factor and then propose possible corrective actions. A diagram is constructed separately for each high priority factor. The ability to create a RCA tree diagram from a mind map is supported by the ConceptDraw Seven Management and Planning Tools solution.

How to Create a PowerPoint Presentation from a SWOT Analysis Mindmap

You can use SWOT analysis PowerPoint presentation to represent strengths, weakness, opportunities, and threats involved in your SWOT matrix.
HelpDesk

How to Create a Fishbone (Ishikawa) Diagram Quickly

A Fishbone (Ishikawa) diagram is also called cause-and-effect diagram. Fishbone diagram is often used in business to determine the cause of some problem. The diagram illustrates the main causes and sub-causes leading to an event. The main goal of the Fishbone diagram is to illustrate in a graphical way the relationship between a given outcome and all the factors that influence this outcome. The complete diagram resembles a fish skeleton as its name implies. The ability to create a Fishbone Diagram is supported by the Fishbone Diagram solution. Use ConceptDraw MINDMAP for structuring data and then ConceptDraw DIAGRAM for generating a Fishbone Diagram from mind map structure.

SWOT Analysis

Using mind mapping to define Strengths, Weaknesses/Limitations, Opportunities, and Threats is a natural fit. SWOT mind maps quickly capture your ideas, and allow you to add and subtract easily, ensuring you don’t overlook any important items.

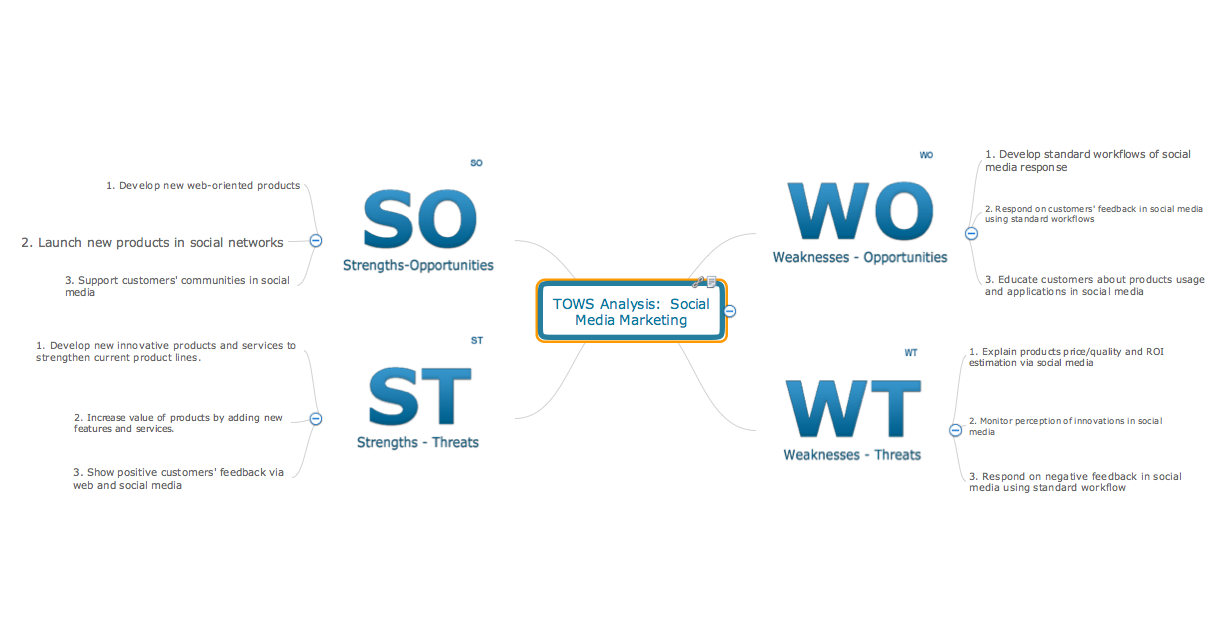
SWOT Analysis Software

SWOT analysis is a powerful tool that helps the business professionals to identify the positives and negatives within an organization and in an external environment. TOWS is a variation of SWOT analysis, more focused on external factors and action planning. The correct and full awareness of the situation is important for strategic planning, as well as for decision making and coordination the company's resources and information capabilities of the competitive environment. SWOT and TOWS Matrix Diagrams solution included to ConceptDraw Solution Park makes the ConceptDraw DIAGRAM a powerful SWOT Analysis software and provides a lot of advantages. First of all note the set of ready-made templates that help to identify the Strengths, Weaknesses, Opportunities, and Threats the most quickly and effectively, and the choice of outputs to present the analysis results as SWOT or TOWS matrix. The well-designed SWOT matrix samples and examples included to SWOT and TOWS Matrix Diagrams solution illustrate the results you can achieve using it and also can be used as a good start for your own matrices.

What is SWOT Analysis?

What is SWOT analysis? The SWOT abbreviation is formed from the reduction of four words - strength, weakness, opportunity and threat, on which is based the SWOT analysis. It is a structured planning method that involves the analysis of the situation within a company, as well as analysis of external factors and the situation on the market. SWOT analysis emphasizes that the strategy must to combine the internal capabilities and external situation the best way as possible. The use of SWOT analysis allows to systemize all available information and apply this clear picture to make informed decisions concerning to your business development. In fact, SWOT analysis is an intermediate step between the formulation of goals and the statement of problem. The main goal is a sustainability and improvement of efficiency of business functioning. When you have an installed ConceptDraw DIAGRAM software, it gives you a lot of benefits in SWOT analysis. Use the powerful drawing tools and capabilities of the SWOT and TOWS Matrix Diagrams solution to hold the SWOT analysis effectively and with pleasure.

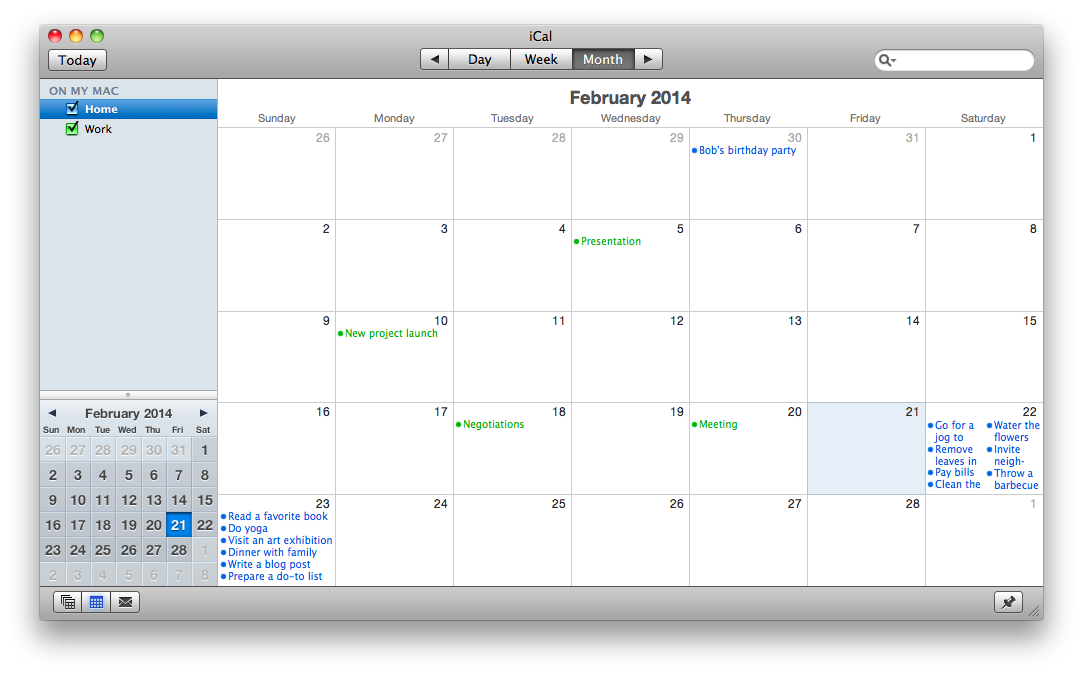
Export from ConceptDraw MINDMAP to Apple iCal
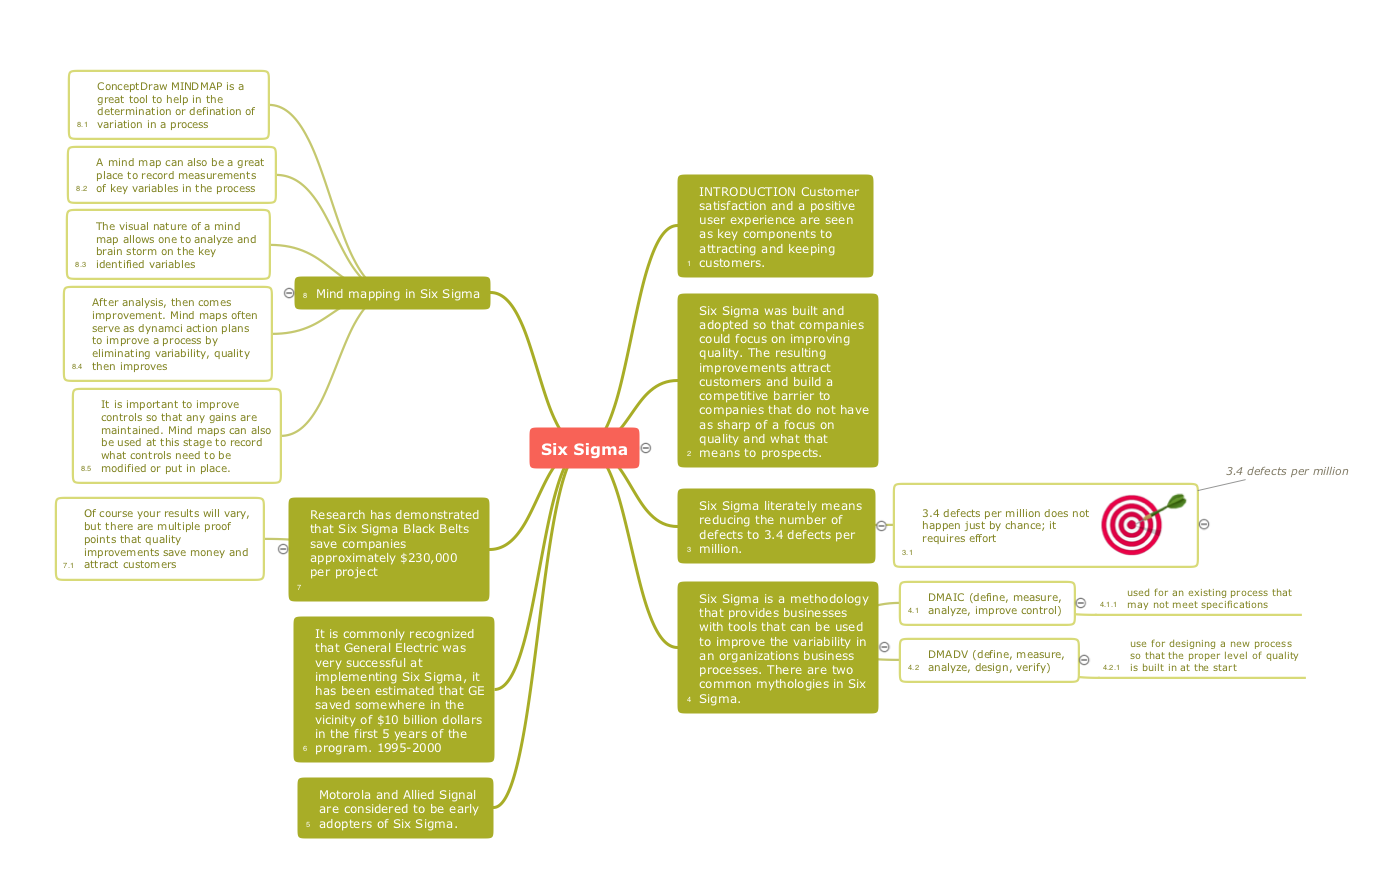
ConceptDraw MINDMAP Mac OS X version enables you to export your mind map into the iCal calendar and generate tasks from mind map topics.

quality management mind map, quality management mindmap Quality Mind Map

quality management mind map, quality management mindmap
This solution extends ConceptDraw MINDMAP software with Quality Management Mind Maps (Presentations, Meeting Agendas, Problem to be solved).