Flowchart design. Flowchart symbols, shapes, stencils and icons
A flowchart is a type of diagram which represents an algorithm, process or workflow, displays the steps as boxes of various kinds and depicts their order by connecting them with arrows. Any business graphic document will be more colorful and understandable if will use professional-looking and visual diagrams and flowcharts. Flowchart design gives versatile presenting and explaining of the process. ConceptDraw PRO flowchart software enhanced with Flowcharts solution helps effectively make Flowchart Design. Use of predesigned flowchart symbols and bright color palette offers a fresh view and favorably distinguishes the flowcharts designed in ConceptDraw PRO from the black and white flowcharts on a paper. Preferably to use no more than three or four colors and apply identical for the same shape types. The best flowchart design can be achieved by starting with Flowchart template, or any of suitable ready examples or samples offered in ConceptDraw STORE, open one of them and enter the proper text into each Flowchart shape. Each symbol of the flowchart has a definition that can't be changed. This means that all flowcharts shapes can be grouped in according to their meaning. Users with ConceptDraw PRO flowchart software can style groups of symbols with close definitions by color sets chosen from complementary palette. Almost all workflows can be depicted as a flowchart. Colored diagrams are more light for perception of the certain information, this is part of flowchart design. Bright colors need to be used in the key points of Decision symbols, to focus attention on their importance for whole process flow.
Value Stream Mapping Icons
The library with 40 vector stencils is included in the ConceptDraw Value Stream Mapping solution.This vector stencils library contains 184 round icons.
Use it to design cloud computing infographics and diagrams with ConceptDraw PRO software.
"Though service-oriented architecture advocates "everything as a service" (with the acronyms EaaS or XaaS or simply aas), cloud-computing providers offer their "services" according to different models, which happen to form a stack: infrastructure-, platform- and software-as-a-service.
Infrastructure as a service (IaaS)
In the most basic cloud-service model ... providers of IaaS offer computers — physical or (more often) virtual machines — and other resources. IaaS refers to online services that abstract the user from the details of infrastructure like physical computing resources, location, data partitioning, scaling, security, backup etc.
Platform as a service (PaaS)
PaaS vendors offer a development environment to application developers. The provider typically develops toolkit and standards for development and channels for distribution and payment. In the PaaS models, cloud providers deliver a computing platform, typically including operating system, programming-language execution environment, database, and web server. Application developers can develop and run their software solutions on a cloud platform without the cost and complexity of buying and managing the underlying hardware and software layers.
Software as a service (SaaS)
In the software as a service (SaaS) model, users gain access to application software and databases. Cloud providers manage the infrastructure and platforms that run the applications. SaaS is sometimes referred to as "on-demand software" and is usually priced on a pay-per-use basis or using a subscription fee.
In the SaaS model, cloud providers install and operate application software in the cloud and cloud users access the software from cloud clients. Cloud users do not manage the cloud infrastructure and platform where the application runs. This eliminates the need to install and run the application on the cloud user's own computers, which simplifies maintenance and support. Cloud applications differ from other applications in their scalability — which can be achieved by cloning tasks onto multiple virtual machines at run-time to meet changing work demand." [Cloud computing. Wikipedia]
The vector stencils library "Cloud round icons" is included in the Cloud Computing Diagrams solution from the Computer and Networks area of ConceptDraw Solution Park.
Process Flowchart
The main reason of using Process Flowchart or PFD is to show relations between major parts of the system. Process Flowcharts are used in process engineering and chemical industry where there is a requirement of depicting relationships between major components only and not include minor parts. Process Flowcharts for single unit or multiple units differ in their structure and implementation. ConceptDraw PRO is Professional business process mapping software for making Process flowcharts, Process flow diagram, Workflow diagram, flowcharts and technical illustrations for business documents and also comprehensive visio for mac application. Easier define and document basic work and data flows, financial, production and quality management processes to increase efficiency of your business with ConcepDraw PRO. Business process mapping software with Flowchart Maker ConceptDraw PRO includes extensive drawing tools, rich examples and templates, process flowchart symbols and shape libraries, smart connectors that allow you create the flowcharts of complex processes, process flow diagrams, procedures and information exchange. Process Flowchart Solution is project management workflow tools which is part ConceptDraw Project marketing project management software. Drawing charts, diagrams, and network layouts has long been the monopoly of Microsoft Visio, making Mac users to struggle when needing such visio alternative like visio for mac, it requires only to view features, make a minor edit to, or print a diagram or chart. Thankfully to MS Visio alternative like ConceptDraw PRO software, this is cross-platform charting and business process management tool, now visio alternative for making sort of visio diagram is not a problem anymore however many people still name it business process visio tools.
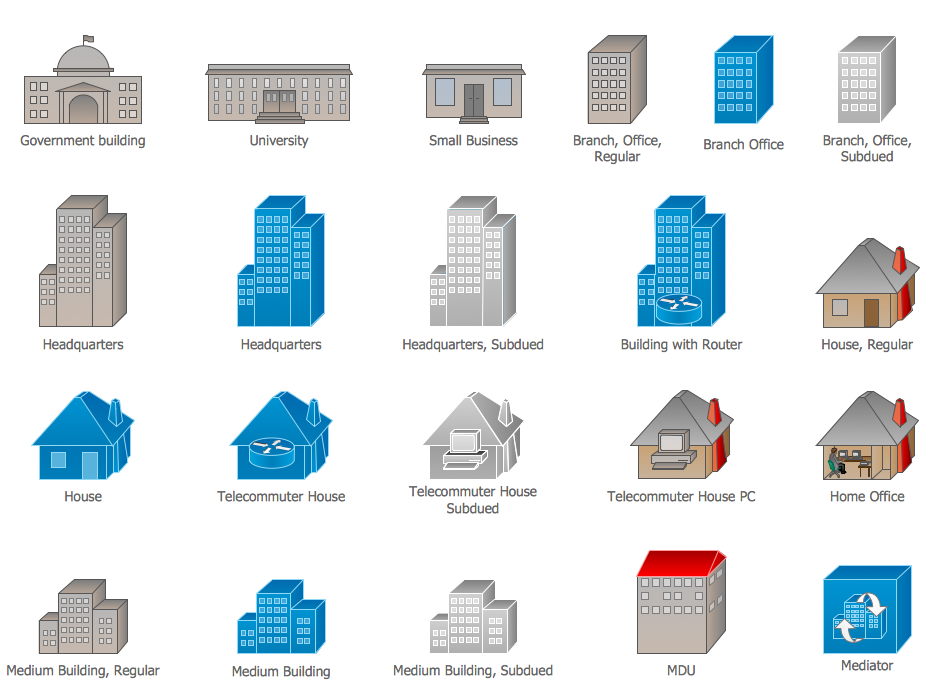
Cisco Buildings. Cisco icons, shapes, stencils and symbols
Cisco icons are globally recognized and generally accepted as standard for network icon topologies. The ConceptDraw vector stencils library "Cisco buildings" contains 21 symbols for drawing the computer network diagrams using the ConceptDraw PRO diagramming and vector drawing software.IDEF0 Flowchart Symbols
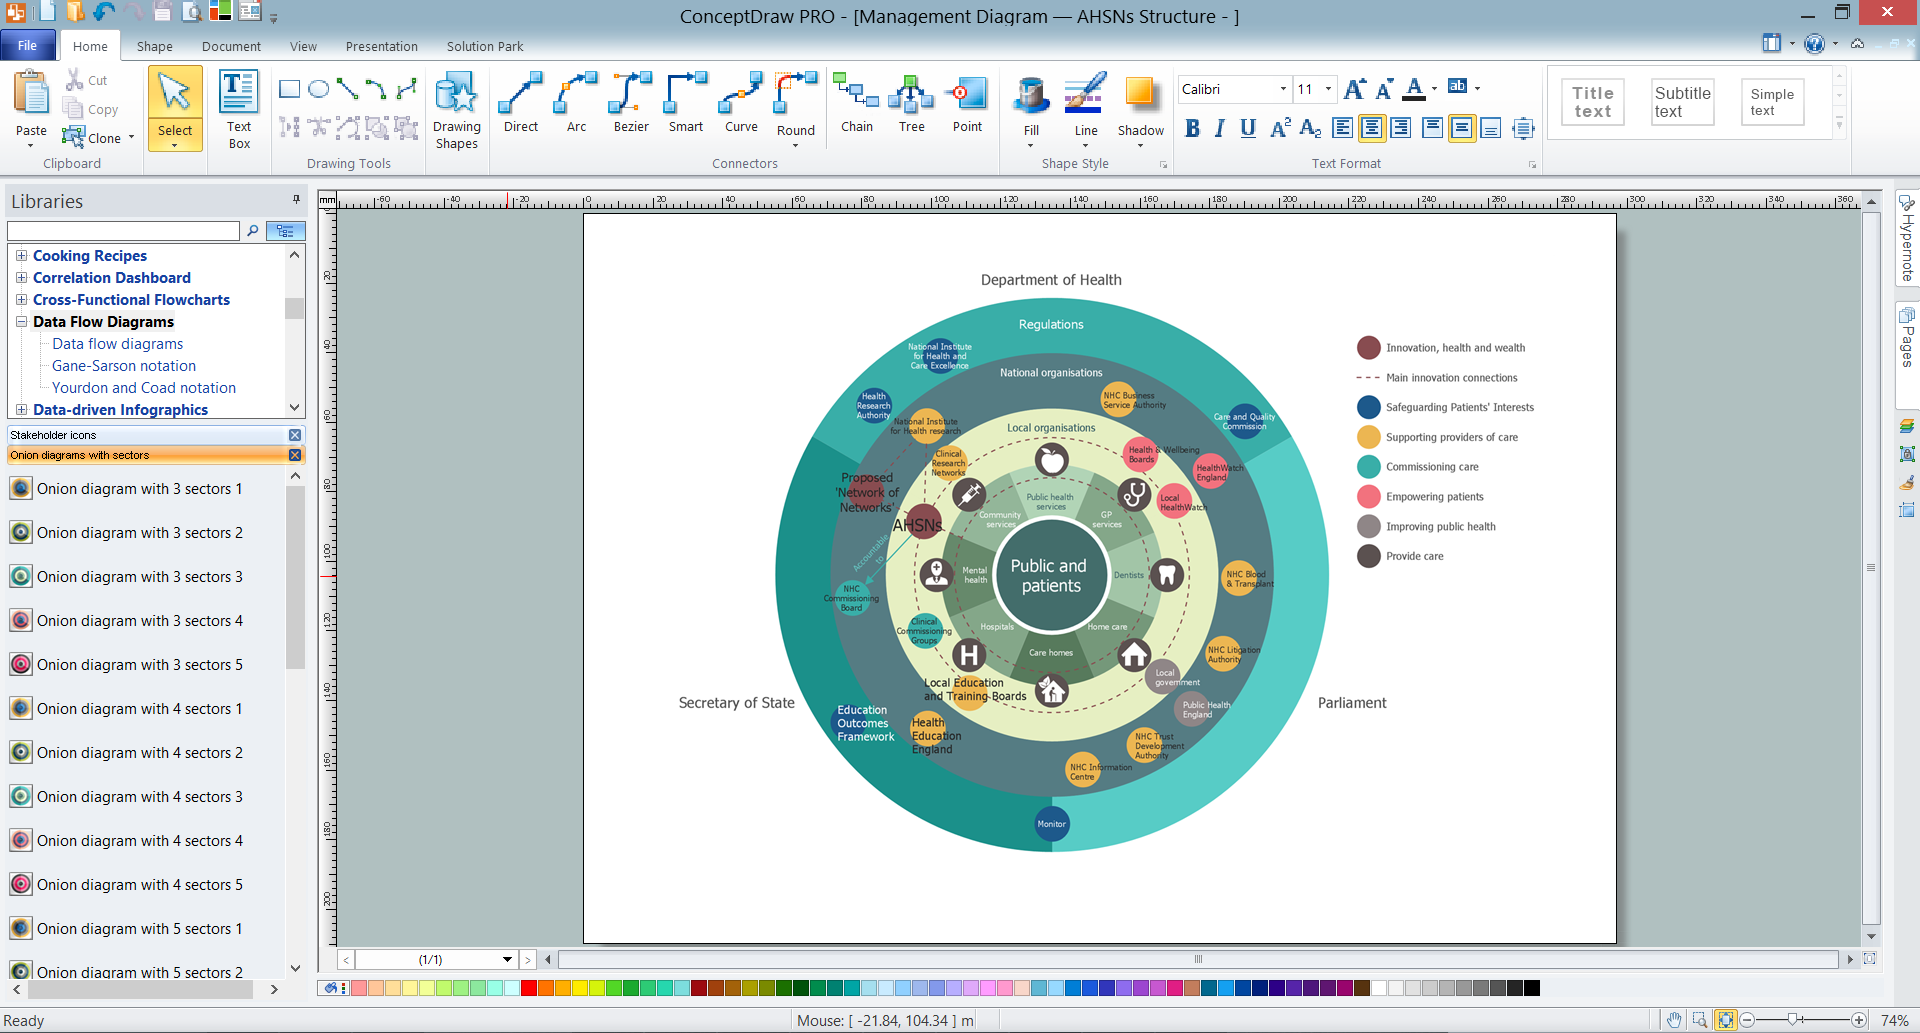
The modeling of business and business processes is not quite a simple process for both small-size businesses and large businesses. The IDEF0 method is one of the popular and easy methods of modeling the business as a complex system. It is based on the functional modeling language Structured Analysis and Design Technique (abbr. SADT) and is concentrated on the activity modeling. According to this method are constructed the IDEF0 Diagrams and IDEF0 Flowcharts, which are succesfully used not only for documenting the business, but also for analysis, development, integration of information and software systems, reengineering, etc. This method suggests the use of special IDEF0 Flowchart Symbols from the IDEF0 notation for construction the IDEF0 Flowcharts. ConceptDraw PRO diagramming and vector graphic software extended with IDEF0 Diagrams solution from the Software Development area of ConceptDraw Solution Park is rich for the powerful drawing tools, built-in templates and samples, and predesigned IDEF0 flowchart symbols.Stakeholder Mapping Tool
Stakeholders are the groups of people or organizations whose contribution matters to the organization's success, this can be labour participation, financial participation, dissemination of information about organization, etc. So, the employees of the company, its suppliers, customers, media, public organizations, state authorities, all they are stakeholders of the company. ConceptDraw PRO diagramming and vector drawing software extended with Stakeholder Onion Diagrams Solution from the Management Area of ConceptDraw Solution Park is a powerful stakeholder mapping tool which allows easy create Stakeholder Onion diagrams and maps depicting the layers of a project, relationships of stakeholders to a project goal, and relationships between stakeholders.The vector stencils library "AWS Analytics" contains 22 icons: Amazon Athena icon, Amazon CloudSearch icons, Amazon EMR icons, Amazon ES icons, Amazon Kinesis icons, Amazon QuickSight icon, Amazon Redshift icons, AWS Data Pipeline icon, AWS Glue icon.
Use it to draw Amazon Web Services architecture diagrams with ConceptDraw PRO diagramming and vector drawing software.
"Amazon Elasticsearch Service is a managed service that makes it easy to deploy, operate, and scale Elasticsearch in the AWS Cloud. Elasticsearch is a popular open-source search and analytics engine for use cases such as log analytics, real-time application monitoring, and click stream analytics." [aws.amazon.com/ elasticsearch-service/ ]
"Amazon Elastic MapReduce (Amazon EMR) is a web service that makes it easy to quickly and cost-effectively process vast amounts of data." [aws.amazon.com/ elasticmapreduce/ ]
"Amazon Kinesis is a platform for streaming data on AWS, offering powerful services to make it easy to load and analyze streaming data, and also providing the ability for you to build custom streaming data applications for specialized needs." [aws.amazon.com/ kinesis/ ]
"Amazon Machine Learning is a service that makes it easy for developers of all skill levels to use machine learning technology." [aws.amazon.com/ machine-learning/ ]
"Amazon QuickSight is a very fast, cloud-powered business intelligence (BI) service that makes it easy for all employees to build visualizations, perform ad-hoc analysis, and quickly get business insights from their data." [aws.amazon.com/ quicksight/ ]
"AWS Data Pipeline is a web service that helps you reliably process and move data between different AWS compute and storage services, as well as on-premise data sources, at specified intervals." [aws.amazon.com/ datapipeline/ ]
The AWS icons example "Design elements - AWS Analytics" is included in the AWS Architecture Diagrams solution from the Computer and Networks area of ConceptDraw Solution Park.
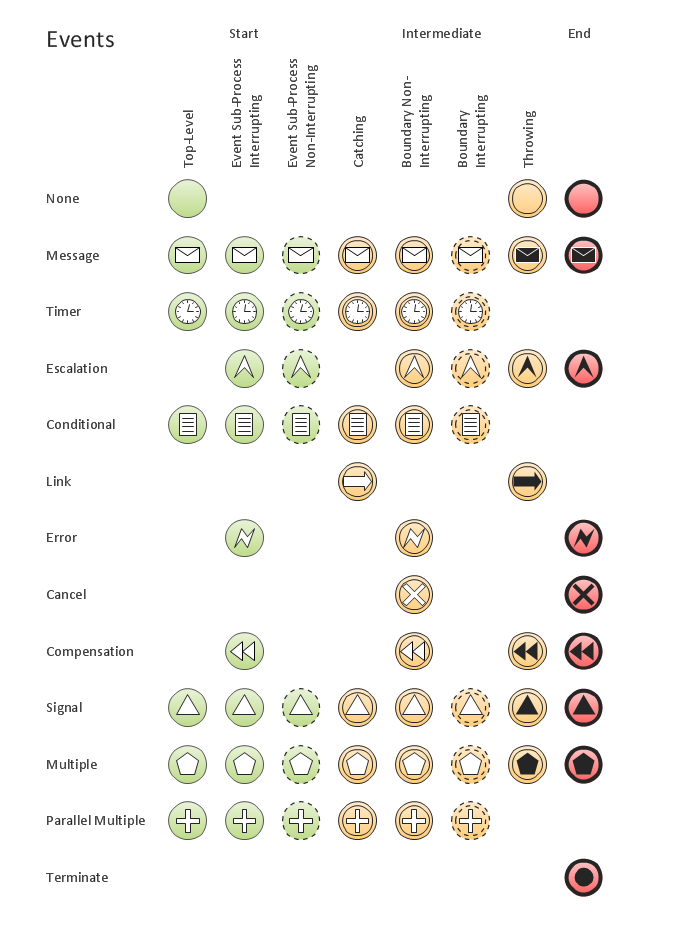
Business Process Elements: Events
Create professional business process diagrams using ConceptDraw Events library with 17 objects from BPMN.
Visualize Stakeholder Analysis
Stakeholder analysis in conflict resolution, project management, and business administration, is the process of identifying the individuals or groups that are likely to affect or be affected by a proposed action, and sorting them according to their impact on the action and the impact the action will have on them. Use the ConceptDraw PRO diagramming and vector drawing software enhanced with powerful tools of Stakeholder Onion Diagrams Solution from the Management Area of ConceptDraw Solution Park to easy and effectively visualize stakeholder analysis.Basic Flowchart Symbols and Meaning
Flowcharts are the best for visually representation the business processes and the flow of a custom-order process through various departments within an organization. ConceptDraw PRO diagramming and vector drawing software extended with Flowcharts solution offers the full set of predesigned basic flowchart symbols which are gathered at two libraries: Flowchart and Flowcharts Rapid Draw. Among them are: process, terminator, decision, data, document, display, manual loop, and many other specific symbols. The meaning for each symbol offered by ConceptDraw gives the presentation about their proposed use in professional Flowcharts for business and technical processes, software algorithms, well-developed structures of web sites, Workflow diagrams, Process flow diagram and correlation in developing on-line instructional projects or business process system. Use of ready flow chart symbols in diagrams is incredibly useful - you need simply drag desired from the libraries to your document and arrange them in required order. There are a few serious alternatives to Visio for Mac, one of them is ConceptDraw PRO. It is one of the main contender with the most similar features and capabilities.
How to Create a Line Chart
Create a Line Chart with ConceptDraw using our tips. Here you can find an explanation of how to create a line chart quickly.Value Stream Mapping Symbols
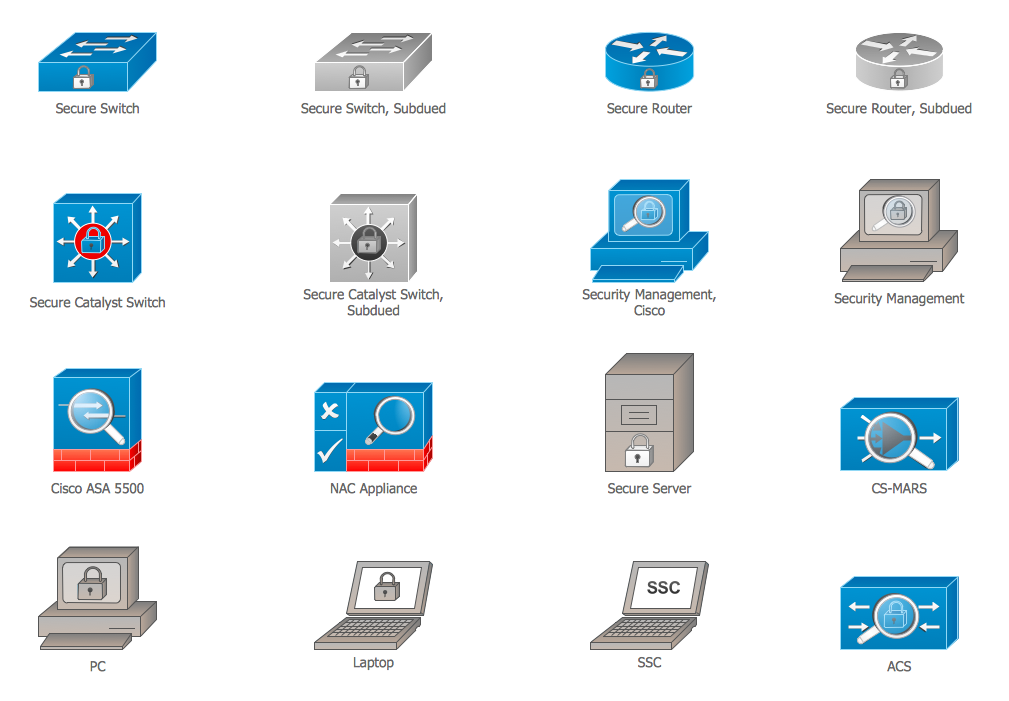
VSM symbols are the best for a production process designing. The entire Value Stream Mapping method uses a graphical representation of the manufacturing process, factors' pros and cons, that all stakeholders can easily understand. Value Stream Mapping is a graphical technique that provides possibilities to improve analysis of a manufacturing process, at the stage of the transferring information or materials that required to deliver a product or service to the customer.Cisco Security. Cisco icons, shapes, stencils and symbols
The ConceptDraw vector stencils library "Cisco Security" contains 16 symbols of security devices and equipment for drawing the computer network diagrams using the ConceptDraw PRO diagramming and vector drawing software.Cisco Network Topology. Cisco icons, shapes, stencils and symbols
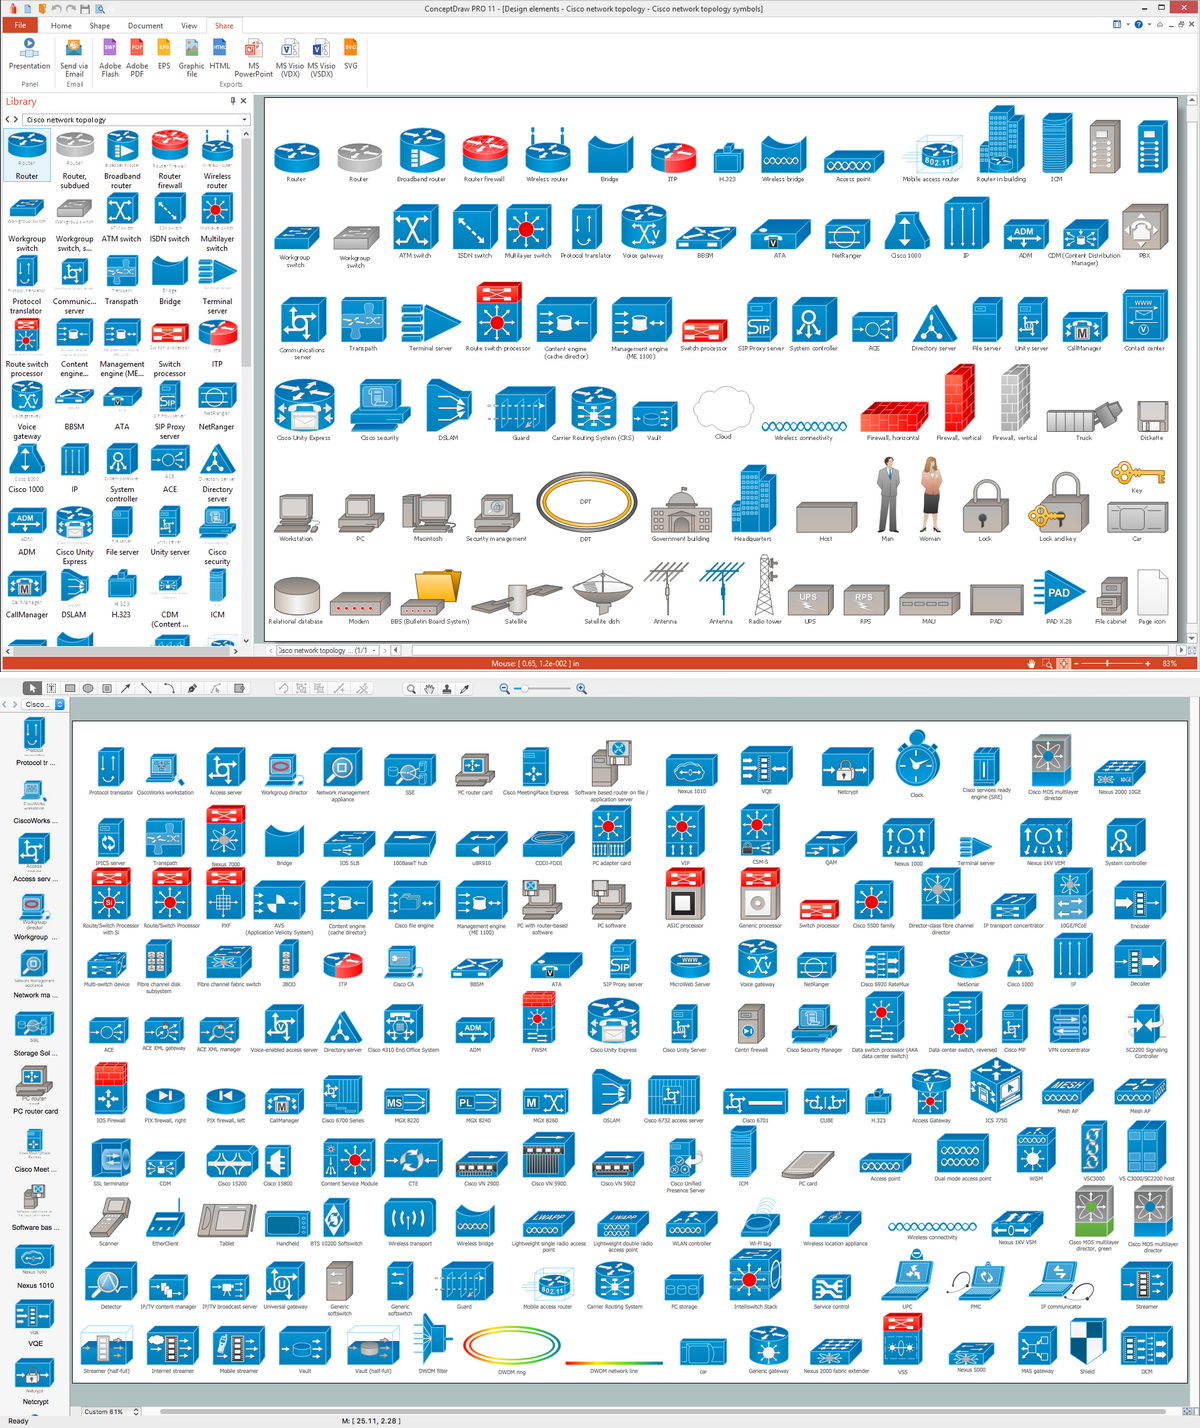
Cisco Network Topology represents the arrangement of worldwide recognized and standardized Cisco network symbols, icons, shapes, and stencils which help visualize the schemes of computer networks. Any equipment used in Cisco networks is also named a node and network topology diagram represents the scheme of connection the used nodes. Cisco Network Diagram illustrates how the signals enter on the networked devices and how the data spread within a network from one device to another. These diagrams are useful for engineers while constructing computer networks and working with them. Cisco Network Diagrams solution included to Computer and Networks area of ConceptDraw Solution Park contains quick-start templates, professionally designed samples and examples, and numerous libraries with a lot of predesigned vector design elements, icons, and shapes of Cisco equipment, components, devices, links which provide for ConceptDraw PRO users a perfect possibility of simple and quick drawing Cisco Network Diagrams and Schematics, Network Designs and Maps of any complexity.- Stakeholder Mapping Tool | Visualize Stakeholder Analysis | Conflict ...
- Stakeholder Analysis Icon Png
- SWOT analysis for a small independent bookstore | Smo Icon
- Competitor Analysis | Mixed Songs Icon
- Root Cause Analysis Icon
- Perform Root Cause Analysis Icon
- Research Methodology Icon Vector
- Process Flowchart | Competitor Analysis | Supply Chain Supplier ...
- Visualize Stakeholder Analysis | Electrical Symbols — Transformers ...
- Professions - Vector stencils library | Fault Tree Analysis Diagrams ...
- Design elements - Stakeholder icons | Stakeholder Onion Diagram ...
- Vegetation Icon Site Analysis
- Fishbone Diagrams | ERD Symbols and Meanings | Men Analyze Icon
- Mind Maps for Business - SWOT Analysis | SWOT analysis matrix ...
- Business Process Elements: Events | How to Make SWOT Analysis ...
- Competitor Analysis | SWOT analysis matrix diagram templates ...
- Job Analysis Icon
- Growth Arrow Icon Png
- Process Flowchart | SWOT Sample in Computers | SWOT analysis ...
- Portfolio Management Icon


