Best Program to Make Diagrams
Make diagrams, charts, workflows, flowcharts, org charts, project charts easily with ConceptDraw software.
The Best Flowchart Software Available
ConceptDraw gives the ability to draw Flowchart documents. Flowcharts solutionis a powerful tool that extends ConceptDraw application for drawing business flowcharts. ConceptDraw DIAGRAM ector diagramming and business graphics software enhanced with with templates, green and interactive flowchart makers, samples and stencil libraries from ConceptDraw Solution Park which all focused to help with drawing flowcharts, block diagrams, bar charts, histograms, pie charts, divided bar diagrams, line graphs, area charts, scatter plots, circular arrows diagrams, Venn diagrams, bubble diagrams, concept maps, and others.
HelpDesk
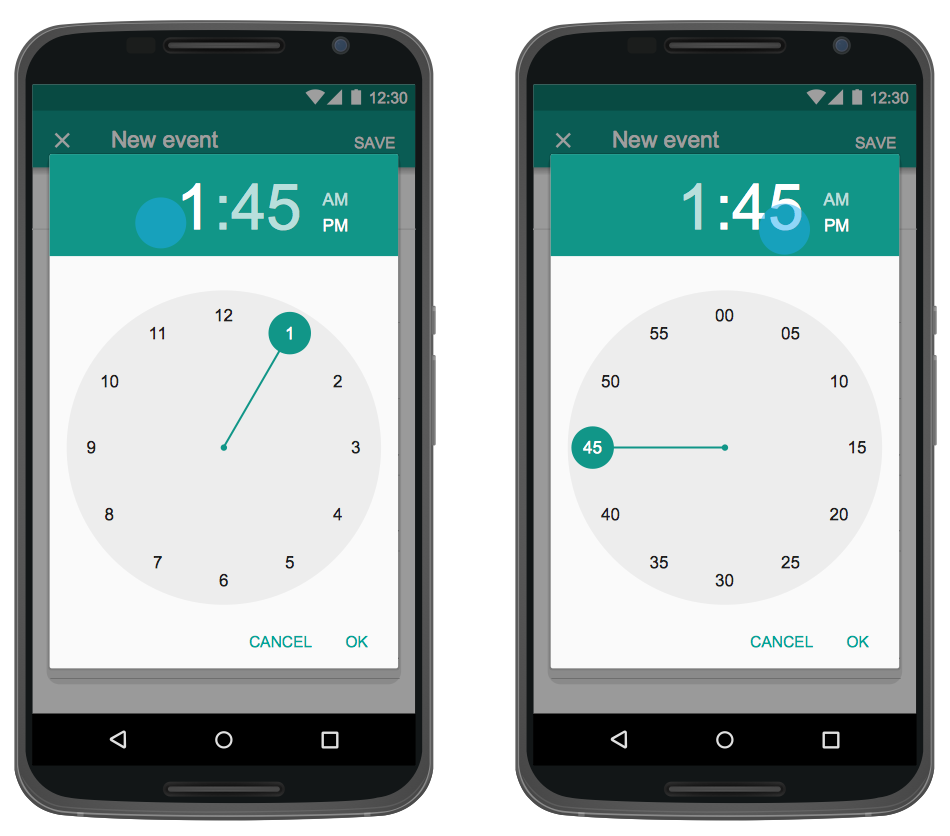
How to Design an Interface Mock-up of an Android Application
Uses Interface prototyping is much convenient when you can work through a diagram similar to the device design. ConceptDraw DIAGRAM allows you to develop Android User Interface (UI) prototypes using the special templates and vector libraries of the specific user interface elements. Using ConceptDraw DIAGRAM you can mock-up an Android UI system so that you can figure out how best to represent user interface (UI) elements for the development of a new mobile Apps.Basic Diagramming
Perfect charts and graphics diagramming software with rich examples and template. ConceptDraw is ideal to draw Charts and Graphics.
Flowchart on Bank. Flowchart Examples
This sample was created in ConceptDraw DIAGRAM diagramming and vector drawing software using the Flowcharts solution from the Diagrams area of ConceptDraw Solution Park. This sample shows the Flowchart of the Subprime Mortgage Crisis. This Flowchart describes the decline in housing prices when the housing bubble burst and what it caused on the housing and financial markets. You can also see the Government and Industry responses in this crisis situation.
Business Diagram Software
When managing the projects, people, or networks, there are daily designed and used different types of Business diagrams, so the powerful drawing software will be very useful for this. ConceptDraw DIAGRAM with large quantity of business solutions will meet your needs and will help you convey your ideas successful and rapidly, no matter are you professional or beginner. It is the best choice for business specialists and technical professionals who need quickly and easily explore, visualize, and communicate information. ConceptDraw DIAGRAM business diagram software is the most powerful business software and relational charting software. Create advanced, completely customizable Business Process Diagrams, Business Flow Charts, Work Flow Diagrams, Organizational Charts, Audit diagrams, Marketing diagrams, Value Stream Maps, TQM diagrams, ERD diagrams, EPC diagrams, Cause and Effect diagrams, Infographics, Dashboards, and other Relational business diagrams from your data using the powerful drawing tools of ConceptDraw Solution Park.
TQM Diagram Tool
The Total Quality Management Diagram solution helps you and your organization visualize business and industrial processes. Create Total Quality Management diagrams for business process with ConceptDraw software.Influence Diagram Software
Influence diagram (ID) is a graphical and mathematical representation of the decision. Influence diagrams are widely used in the decision analysis and in the game theory. They are the alternative to the decision tree. The influence diagram gives to analyst the high-level conceptual view that it can use to build the detailed quantitative model. This sample shows the Influence diagram. It is a directed acyclic graph with three types of nodes: Decision node is drawn as a rectangle, Uncertainty node is drawn as an oval, Value node is drawn as an octagon. The nodes are connected with arcs.Household Moving Checklist
This sample was created in ConceptDraw DIAGRAM diagramming and vector drawing software using the Basic Diagramming Solution from the Universal Diagramming area of ConceptDraw Solution Park. This sample shows the household moving checklist. It's very important to make the checklist of the things when you move from one house to another. When you have the checklist your moving will be easy and simple, and you will not forget anything.Think and act effectively
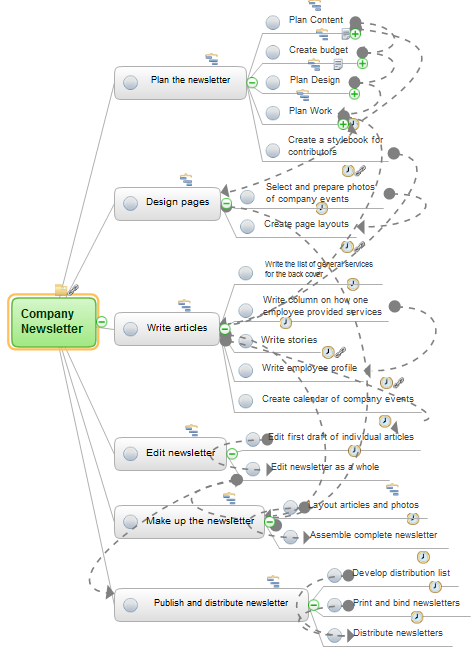
Many people who use mind mapping software for personal organizing find ConceptDraw MINDMAP sufficiently useful mind mapping tool in their business and daily life. Especially many positive responses receive ConceptDraw MINDMAP as cross platform tool to mind maps for Macintosh and Windows.- Top 5 Android Flow Chart Apps | DroidDia prime | Bio Flowchart ...
- Use the Best FlowChart Tool for the Job | Top 5 Android Flow Chart ...
- Top 5 Android Flow Chart Apps | The Best Flowchart Software ...
- Best Flowchart For Android Apps
- Top 5 Android Flow Chart Apps | Best Flowcharts | How to Design an ...
- The Best Flow Chart Maker App For Android
- Top 5 Android Flow Chart Apps | LLNL Flow Charts | In searching of ...
- Top 5 Android Flow Chart Apps | Process Flowchart | Cross ...
- Top 5 Android Flow Chart Apps | How to Design an Interface Mock ...
- Top 5 Android Flow Chart Apps | Process Flowchart | Army Flow ...
- Process Flowchart | Top 5 Android Flow Chart Apps | Easy Flowchart ...
- Top 5 Android Flow Chart Apps | Good Flow Chart app for Mac ...
- Process Flowchart | Top 5 Android Flow Chart Apps | Flowchart ...
- Top 5 Android Flow Chart Apps | Cross-Functional Flowchart (Swim ...
- Top 5 Android Flow Chart Apps | Flow Chart Online | Create Flow ...
- Flow Chart Online | Top 5 Android Flow Chart Apps | Create Flow ...
- Best Flowchart Software and Flowchart Symbols | The Best ...
- Top 5 Android Flow Chart Apps | Cross-Functional Flowchart ...
- Top 5 Android Flow Chart Apps | Flowchart Software | Top iPad ...
- Top 5 Android Flow Chart Apps | Classroom Seating Chart Maker ...


