Workflow Application
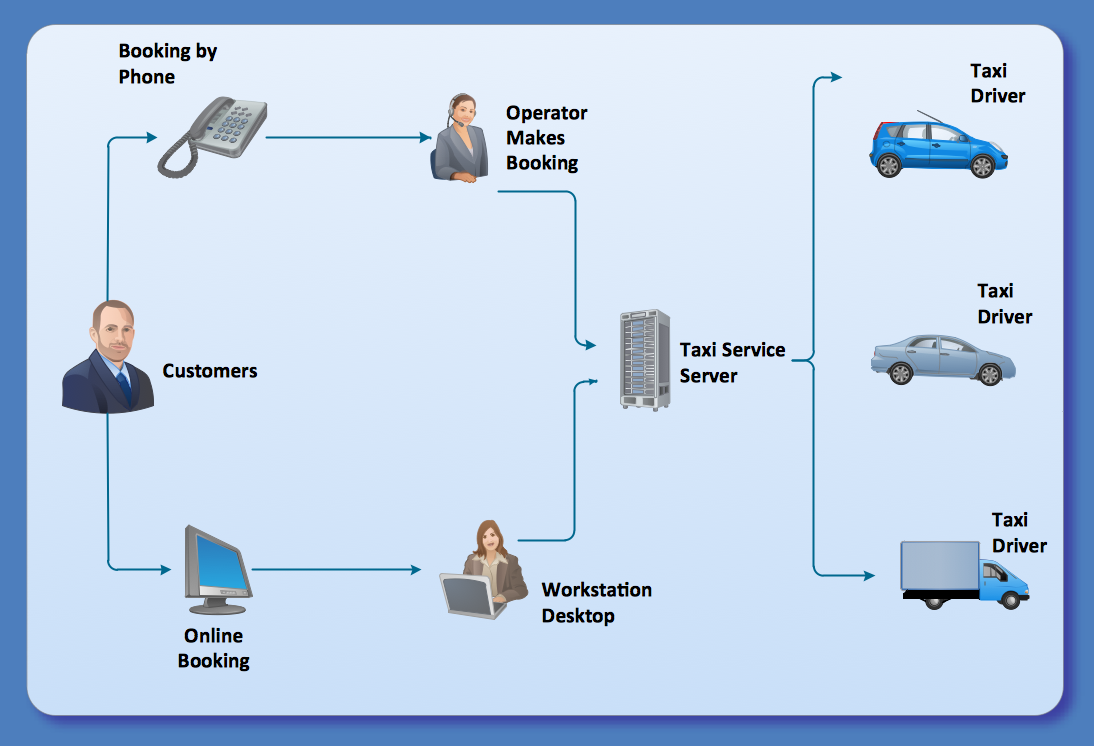
ConceptDraw DIAGRAM application is perfect for creating workflow diagrams. This application contains specific features and technologies designed to draw diagrams faster, such as RapidDraw and Arrows10. ConceptDraw DIAGRAM software extended with the Workflow Diagrams solution gives you a flexible tool to draw any kind of workflow.Best Vector Drawing Application for Mac OS X
ConceptDraw DIAGRAM creates drawings, diagrams and charts with great visual appeal in Mac OS X.Cloud Computing Architecture Diagrams
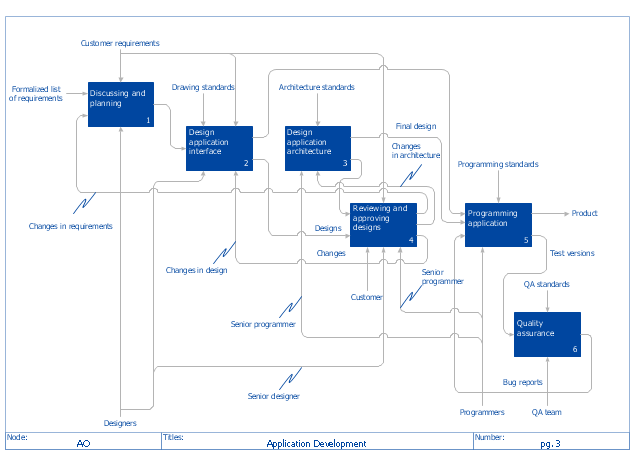
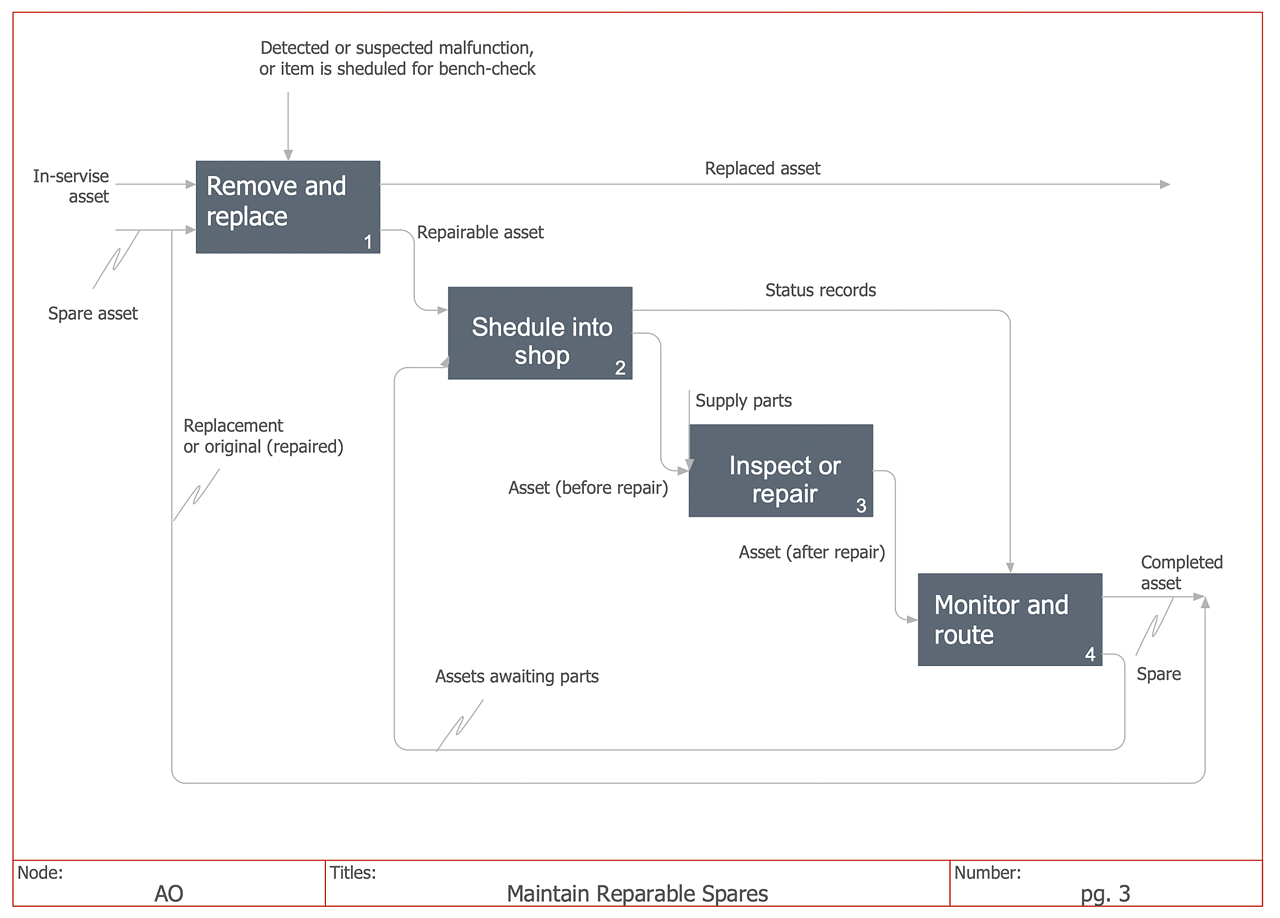
For documenting the Cloud Computing Architecture with a goal to facilitate the communication between stakeholders are successfully used the Cloud Computing Architecture diagrams. It is convenient and easy to draw various Cloud Computing Architecture diagrams in ConceptDraw DIAGRAM software with help of tools of the Cloud Computing Diagrams Solution from the Computer and Networks Area of ConceptDraw Solution Park."The IDEF0 Functional Modeling method is designed to model the decisions, actions, and activities of an organization or system. ...
IDEF0 includes both a definition of a graphical modeling language (syntax and semantics) and a description of a comprehensive methodology for developing models. ...
IDEF0 is used to show data flow, system control, and the functional flow of lifecycle processes. IDEF0 is capable of graphically representing a wide variety of business, manufacturing and other types of enterprise operations to any level of detail. It provides rigorous and precise description, and promotes consistency of usage and interpretation." [IDEF0. Wikipedia]
The IDEF0 diagram example "Application development" was created using the ConceptDraw PRO diagramming and vector drawing software extended with the IDEF0 Diagrams solution from the Software Development area of ConceptDraw Solution Park.
How To create Diagrams for Amazon Web Services architecture
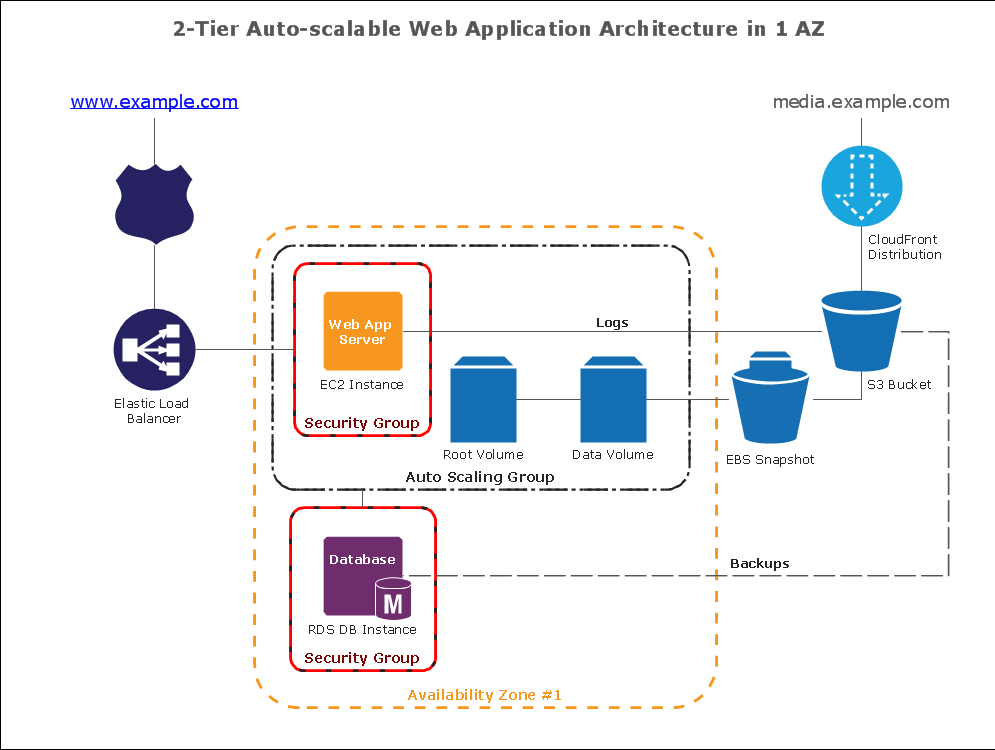
Want to create Diagrams for Amazon Web Services architecture? ConceptDraw Solution Park with AWS architecture Solution will help you!Amazon Web Services Diagrams diagramming tool for architecture
Amazon Web Services (AWS) offers the reliable and relatively inexpensive cloud computing services. This is the main reason why many large companies prefer to use the Amazon Cloud to storage and operate the data. ConceptDraw DIAGRAM diagramming software enhanced with AWS Architecture Diagrams solution provides the powerful AWS diagramming tools to draw the Amazon architecture diagrams and Amazon Web Services planning diagrams, to develop the Architect infrastructure based on AWS in a few minutes. The AWS Architecture Diagrams solution offers variety of built-in samples and templates for several Amazon Web Services products and resources, a wide range of predesigned and recognizable vector graphic icons used for simple designing the Architecture diagrams. The diagrams created in ConceptDraw DIAGRAM are professional-looking, helpful when designing and implementing the AWS infrastructure based systems, useful to communicate design, deployment and topology, and apposite for using in presentations, whitepapers, datasheets, posters, and other technical materials you like.Simple Drawing Applications for Mac
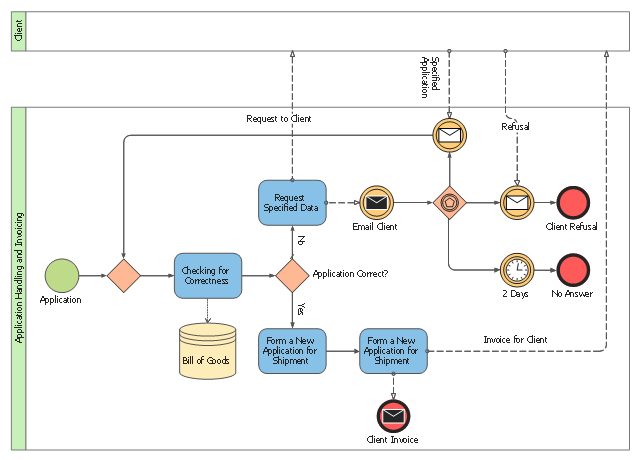
ConceptDraw gives the ability to draw simple diagrams like flowcharts, block diagrams, bar charts, histograms, pie charts, divided bar diagrams, line graphs, area charts, scatter plots, circular arrows diagrams, Venn diagrams, bubble diagrams, concept maps, and others.This BPMN (Business Process Model and Notation) collaboration diagram sample contains the collection of participants and their interaction throughout an application handling and invoicing process.
"An invoice, bill or tab is a commercial document issued by a seller to a buyer, relating to a sale transaction and indicating the products, quantities, and agreed prices for products or services the seller has provided the buyer.
Payment terms are usually stated on the invoice. These may specify that the buyer has a maximum number of days in which to pay, and is sometimes offered a discount if paid before the due date. The buyer could have already paid for the products or services listed on the invoice.
In the rental industry, an invoice must include a specific reference to the duration of the time being billed, so in addition to quantity, price and discount the invoicing amount is also based on duration. Generally each line of a rental invoice will refer to the actual hours, days, weeks, months, etc., being billed.
From the point of view of a seller, an invoice is a sales invoice. From the point of view of a buyer, an invoice is a purchase invoice. The document indicates the buyer and seller, but the term invoice indicates money is owed or owing." [Invoice. Wikipedia]
The business process modeling diagram example "Application handling and invoicing - Collaboration BPMN 2.0 diagram" was designed using the ConceptDraw PRO diagramming and vector drawing software extended with the Business Process Diagram solution from the Business Processes area of ConceptDraw Solution Park.
"An application server can be either a software framework that provides a generalized approach to creating an application-server implementation, without regard to what the application functions are, or the server portion of a specific implementation instance. In either case, the server's function is dedicated to the efficient execution of procedures (programs, routines, scripts) for supporting its applied applications." [Application server. Wikipedia]
"Hardware requirement for servers vary, depending on the server application. Absolute CPU speed is not quite as critical to a server as it is to a desktop machine. Servers' duties to provide service to many users over a network lead to different requirements such as fast network connections and high I/ O throughout. Since servers are usually accessed over a network, they may run in headless mode without a monitor or input device. Processes that are not needed for the server's function are not used. Many servers do not have a graphical user interface (GUI) as it is unnecessary and consumes resources that could be allocated elsewhere. Similarly, audio and USB interfaces may be omitted. ...
As servers need a stable power supply, good Internet access, increased security and are also noisy, it is usual to store them in dedicated server centers or special rooms. This requires reducing the power consumption, as the extra energy used generates more heat thus causing the temperature in the room to exceed acceptable limits; hence normally, server rooms are equipped with air conditioning devices. Server casings are usually flat and wide (typically measured in "rack units"), adapted to store many devices next to each other in a server rack. Unlike ordinary computers, servers usually can be configured, powered up and down or rebooted remotely, using out-of-band management, typically based on IPMI." [Server (computing). Wikipedia]
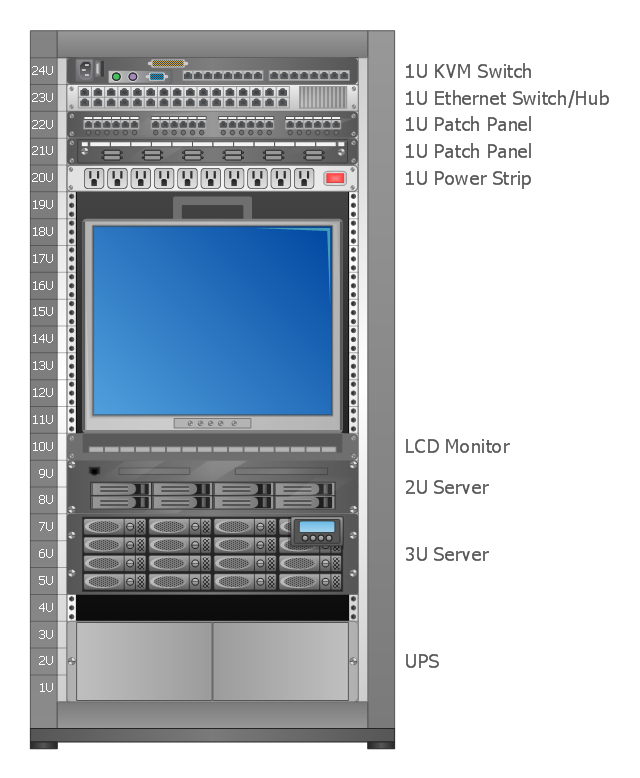
A rack diagram is useful for designing and documenting of network rack server equipment (19-inch or 23-inch rack, rack cabinet, rack unit, network switch, router, KVM switch, server) of data centers, ISP facilities and corporate server rooms.
This application server rack diagram example was created using the ConceptDraw PRO diagramming and vector drawing software extended with the Rack Diagrams solution from the Computer and Networks area of ConceptDraw Solution Park.
HelpDesk
How to Create an IDEF0 Diagram for an Application Development
IDEF0 methods are intended to model the functions of a process, creating a graphical model that displays: what controls the function, who makes it, what resources are used and how they are connected with other functions. The IDEF0 tool is used to model the decisions, actions, and activities of a software system during the development process. IDEF0 diagram graphically depicts a model of a desired version of the application. ConceptDraw DIAGRAM allows you to create and communicate the IDEF0 diagrams of any complexity.- Network Diagram Examples | Application Topology Diagram
- Application Context Diagram
- Application Of Venn Diagram In Engineering
- Er Diagram Of Any Android Application Project
- Data Flow Diagram For Android Mobile Applications
- Workflow Application | AWS Architecture Diagrams | Push ...
- Application Form Workflow Diagram
- Application development - IDEF0 diagram | How to Create an IDEF0 ...
- How To Draw Architecture Diagram For Web Application Using Visio
- Php Web Application Architecture Diagram
