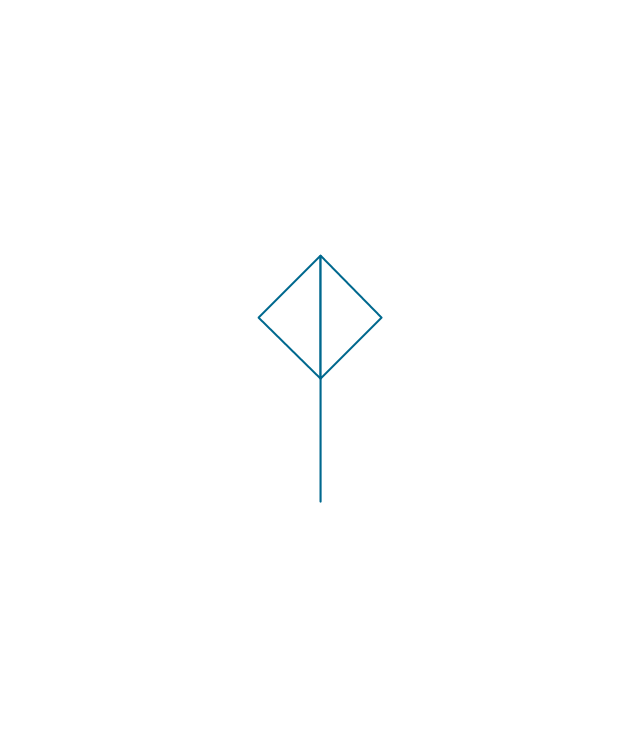
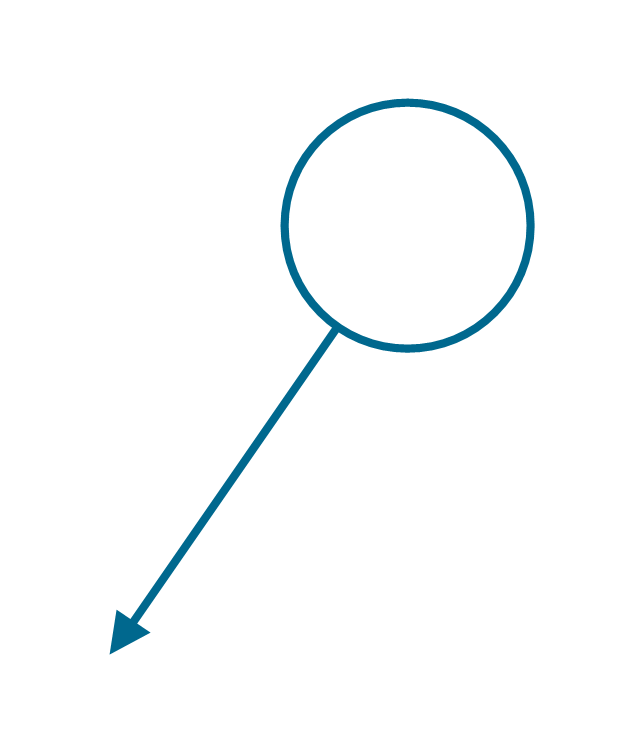
This vector stencils library contains 22 symbols of process annotations for setting automatic labels to display a datasheet field for a pipeline shape, labels, captions, outlines, off-sheet labels, text balloons, annotations, outlines, tags, and descriptions.
Use these shapes for drawing Process Flow Diagrams (PFD) and Piping and Instrumentation Diagrams (P&ID) in the ConceptDraw PRO software extended with the Chemical and Process Engineering solution from the Chemical and Process Engineering area of ConceptDraw Solution Park.
www.conceptdraw.com/ solution-park/ engineering-chemical-process
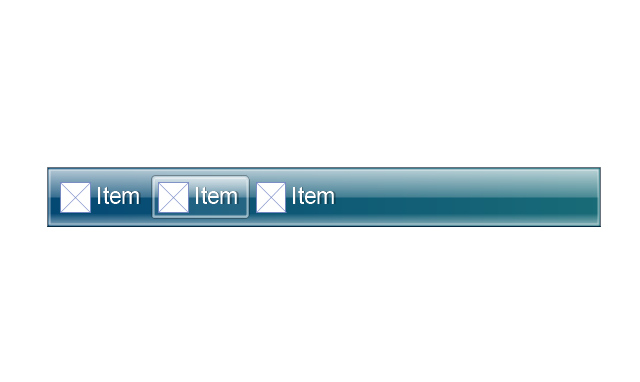
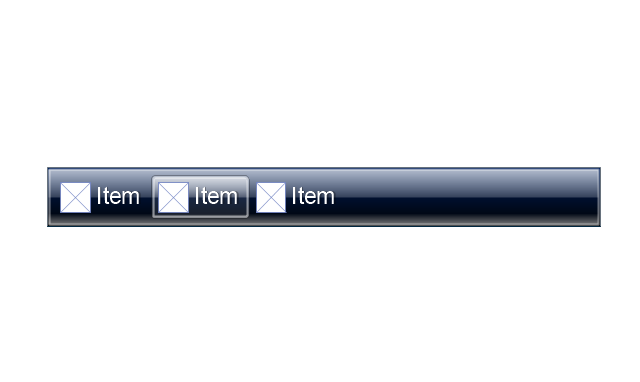
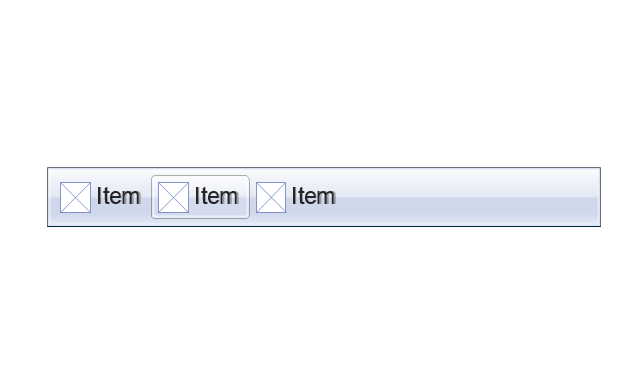
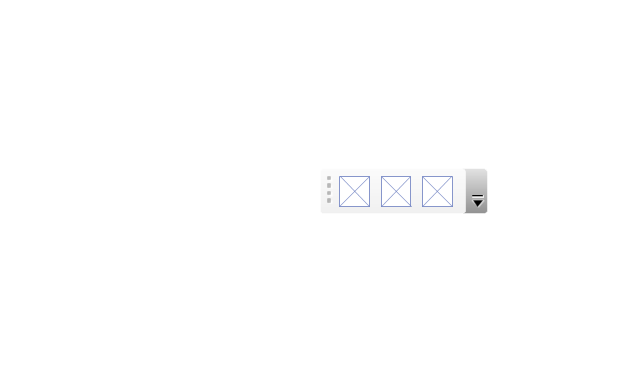
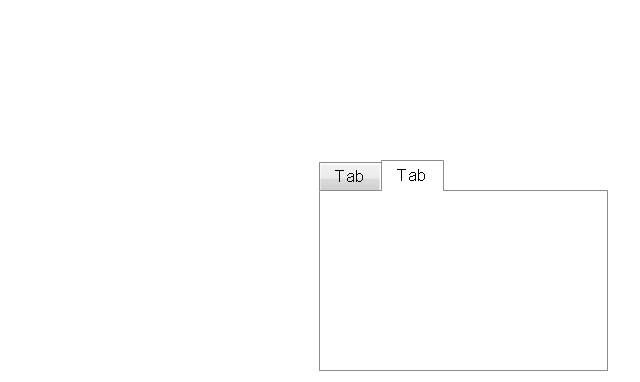
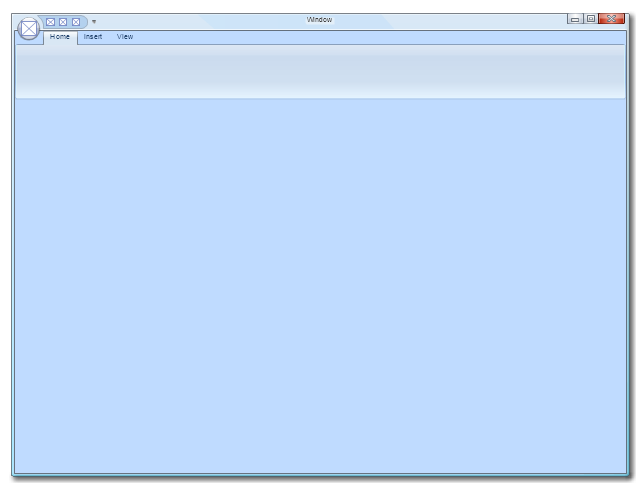
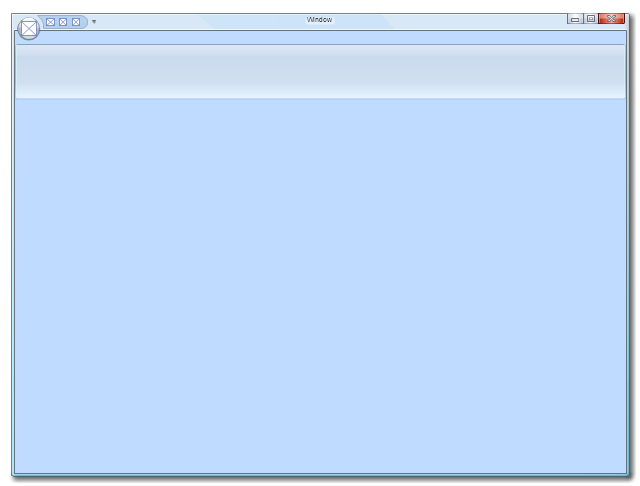
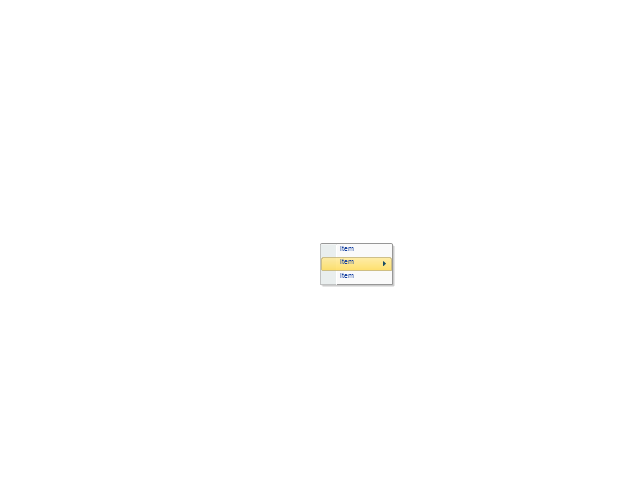
The vector stencils library "Ribbon interface" contains 41 ribbon shapes.
Use it for designing Microsoft ribbon graphic user interface (GUI) of software for Windows computers in the ConceptDraw PRO diagramming and vector drawing software extended with the Graphic User Interface solution from the Software Development area of ConceptDraw Solution Park.
Use it for designing Microsoft ribbon graphic user interface (GUI) of software for Windows computers in the ConceptDraw PRO diagramming and vector drawing software extended with the Graphic User Interface solution from the Software Development area of ConceptDraw Solution Park.
HelpDesk
How to Create a Bar Chart in ConceptDraw PRO
Bar charts (bar graphs) are diagrams displaying data as horizontal or vertical bars of certain heights. Bar charts are widely used to show and compare the values of the same parameters for different data groups. The bar graph can be vertical or horizontal. This depends on the amount of categories. There are many methods in which bar graph can be built and this makes it a very often used chart type. Usually, a bar chart is created so that the bars are placed vertically. Such arrangement means that the bar's height value is proportional to the category value. Nevertheless, a bar chart can be also drawn horizontally. This means that the longer the bar, the bigger the category. Thus, a bar chart is a good way to present the relative values of different measured items. The ConceptDraw Bar Graphs solution allows you to draw a bar chart quickly using a vector library, containing the set of various bar charts objects.The vector stencils library "Controls" contains 53 icons of Windows 8 controls.
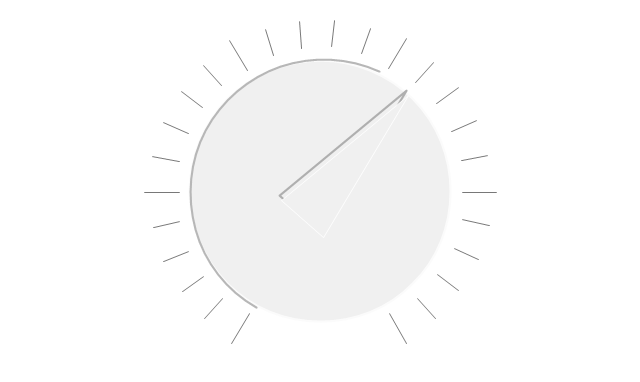
Use it to design graphic user interface (GUI) prototypes of your software applications for Windows 8.
"A graphical control element or widget is an element of interaction in a graphical user interface (GUI), such as a button or a scroll bar. Controls are software components that a computer user interacts with through direct manipulation to read or edit information about an application. ...
Each widget facilitates a specific type of user-computer interaction, and appears as a visible part of the application's GUI as defined by the theme and rendered by the rendering engine. The theme makes all graphical control elements adhere to a unified aesthetic design and creates a sense of overall cohesion. Some widgets support interaction with the user, for example labels, buttons, and check boxes. Others act as containers that group the widgets added to them, for example windows, panels, and tabs." [Graphical control element. Wikipedia]
The design elements example "Controls - Vector stencils library" was created using the ConceptDraw PRO diagramming and vector drawing software extended with the Windows 8 User Interface solution from the Software Development area of ConceptDraw Solution Park.
The vector stencils library "General window elements" contains 31 window elements.
Use this window UI icon set to design graphic user interface (GUI) of your software application for OS X 10.10 Yosemite Apple Mac operating system.
The example "General window elements - Vector stencils library" was created using the ConceptDraw PRO diagramming and vector drawing software extended with the Mac OS User Interface solution from the Software Development area of ConceptDraw Solution Park.
The vector stencils library "Marketing" contains 30 marketing icons.
Use it to design your business and finance illustrations and infographics with ConceptDraw PRO diagramming and vector drawing software.
The vector stencils library "Marketing" is included in the Business and Finance solution from the Illustration area of ConceptDraw Solution Park.
Use it to design your business and finance illustrations and infographics with ConceptDraw PRO diagramming and vector drawing software.
The vector stencils library "Marketing" is included in the Business and Finance solution from the Illustration area of ConceptDraw Solution Park.
The vector stencils library "Transmission paths" contains 43 symbols of power transmission paths, electronic circuits, bus connectors and elbows, terminals, junctions, and concentrators.
Use it to annotate electrical diagrams, electronic schematics and circuit diagrams in the ConceptDraw PRO diagramming and vector drawing software extended with the Electrical Engineering solution from the Engineering area of ConceptDraw Solution Park.
www.conceptdraw.com/ solution-park/ engineering-electrical
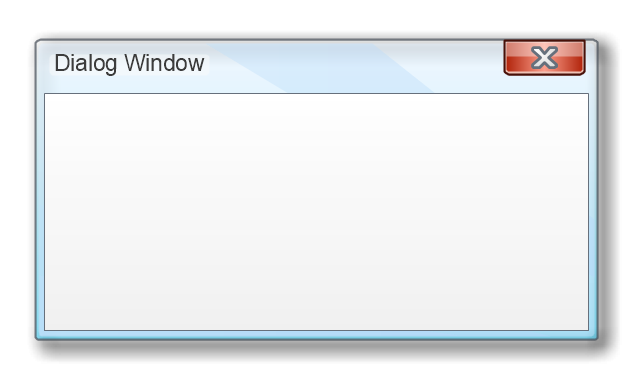
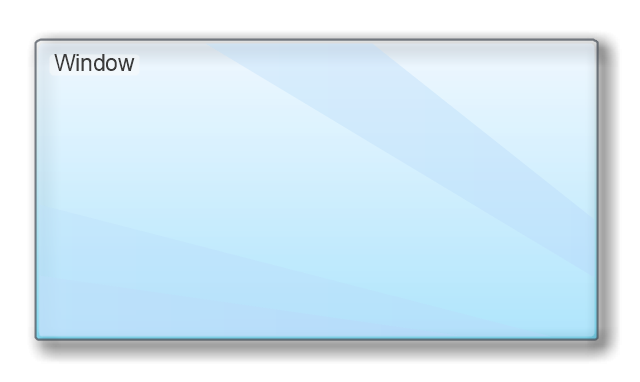
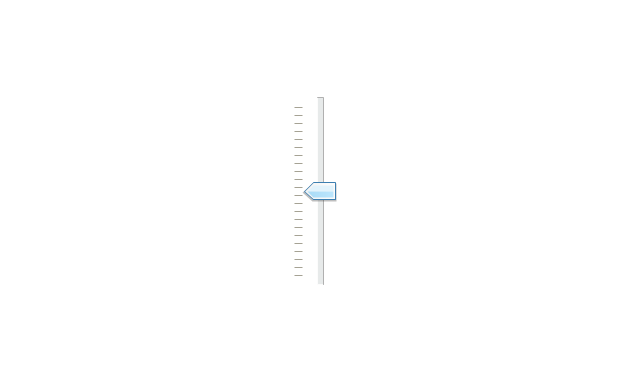
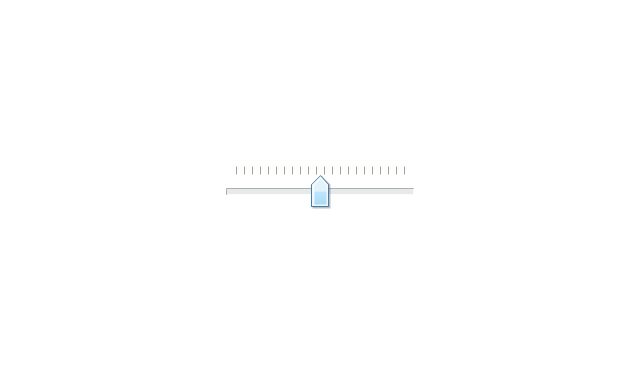
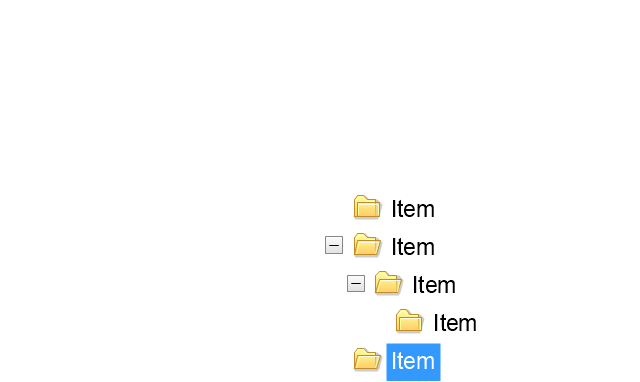
The vector stencils library "MS Windows Vista user interface" contains 76 MS Windows Vista design elements.
Use it for designing Microsoft ribbon graphic user interface (GUI) of software for computers with MS Windows Vista OS in the ConceptDraw PRO diagramming and vector drawing software extended with the Graphic User Interface solution from the Software Development area of ConceptDraw Solution Park.
Use it for designing Microsoft ribbon graphic user interface (GUI) of software for computers with MS Windows Vista OS in the ConceptDraw PRO diagramming and vector drawing software extended with the Graphic User Interface solution from the Software Development area of ConceptDraw Solution Park.
- Group Interaction Vector Png
- Box Png Images
- Scroll Bar Icon Png
- Sales Marketing Vector Png
- Ribbon Design Png
- Callout Shapes Png
- Call Out Png
- Transparent Circle Png
- Starburst Png
- Block diagram - Porter's five forces model
- Chemical and Process Engineering | How to Draw a Chemical ...
- Close Window Button Png
- Dropdown Icon Png
- Png Rectangle
- GHS Label Pictograms | Multiprotocol Label Switching (MPLS ...
- How to Draw an Organization Chart | Organizational Structure ...
- Process Flowchart | Chemical and Process Engineering | Process ...
- Basic Flowchart Symbols and Meaning | Entity Relationship ...
- Sales Cart Png
- 125 Ways to Integrate Social Media to Increase Your Business | How ...
-process-annotations---vector-stencils-library.png--diagram-flowchart-example.png)
-process-annotations---vector-stencils-library.png--diagram-flowchart-example.png)

-process-annotations---vector-stencils-library.png--diagram-flowchart-example.png)
-process-annotations---vector-stencils-library.png--diagram-flowchart-example.png)



























-ribbon-interface---vector-stencils-library.png--diagram-flowchart-example.png)






-ribbon-interface---vector-stencils-library.png--diagram-flowchart-example.png)
-ribbon-interface---vector-stencils-library.png--diagram-flowchart-example.png)
-ribbon-interface---vector-stencils-library.png--diagram-flowchart-example.png)
