 Venn Diagrams
Venn Diagrams are actively used to illustrate simple set relationships in set theory and probability theory, logic and statistics, mathematics and computer science, linguistics, sociology, and marketing. Venn Diagrams are also often used to visually summarize the status and future viability of a project.
Venn Diagram Examples for Problem Solving. Environmental Social Science. Human Sustainability Confluence
The Venn diagram example below shows sustainable development at the confluence of three constituent parts. Create your Venn diagrams for problem solving in environmental social science using the ConceptDraw DIAGRAM diagramming and vector drawing software extended with the Venn Diagrams solution from the area "Diagrams" of ConceptDraw Solution Park.
 Line Graphs
How to draw a Line Graph with ease? The Line Graphs solution extends the capabilities of ConceptDraw DIAGRAM with professionally designed templates, samples, and a library of vector stencils for drawing perfect Line Graphs.
 Target and Circular Diagrams
This solution extends ConceptDraw DIAGRAM software with samples, templates and library of design elements for drawing the Target and Circular Diagrams.
 Stakeholder Onion Diagrams
The Stakeholder Onion Diagram is often used as a way to view the relationships of stakeholders to a project goal. A basic Onion Diagram contains a rich information. It shows significance of stakeholders that will have has influence to the success achieve
 Circle-Spoke Diagrams
Examples of subject areas that are well suited to this approach are marketing, business, products promotion, process modeling, market, resource, time, and cost analysis. Circle-Spoke Diagrams are successfully used in presentations, conferences, management documents, magazines, reportages, reviews, reports, TV, and social media.
Human Resources
Human resources is the set of individuals who make up the workforce of an organization, business sector, or economy. ConceptDraw DIAGRAM diagramming and vector drawing software extended with unique HR Flowcharts Solution from the Management Area of ConceptDraw Solution Park is the best for designing various flowcharts and diagrams in the field of human resources management.Economic Calendar
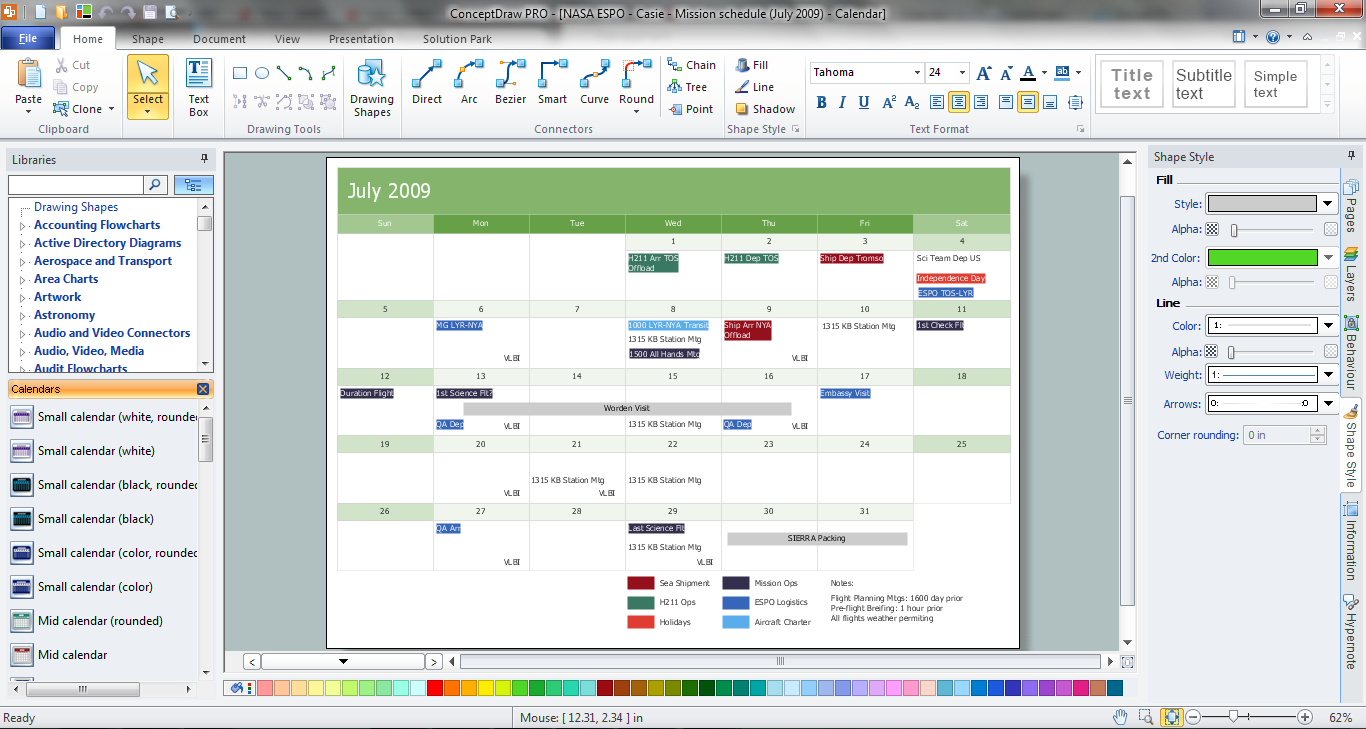
The economic calendar is a convenient way to display the economic events, the situation on the financial markets, it is a handy tool to keep track the chronology and dynamics of important events in the economy. But how design an economic calendar? ConceptDraw DIAGRAM extended with Calendars Solution from the Management Area is a useful, convenient and effective software for quick and easy design professional looking and attractive economic calendars.In searching of alternative to MS Visio for MAC and PC with ConceptDraw DIAGRAM
Undoubtedly MS Visio is a powerful and multifunctional tool, but however at times occur the instances, when it turns unable of meeting certain users' requirements. At this cases you may need to use an alternative program software, preferably it will be simple, convenient, and at the same time powerful and professional. In searching the alternative to MS Visio for MAC and PC we recommend you to pay attention for ConceptDraw DIAGRAM software, which was developed to satisfy all your drawing needs and requirements. It is a fully-functioned alternative product to MS Visio for both platforms. ConceptDraw DIAGRAM software has many advantages, the main among them are the cross-platform compatibility, a reasonable price, widespread ConceptDraw Solution Park with huge variety of different solutions that offer numerous libraries of specialized vector objects, useful examples, samples, and quick-start templates, extensive import / export capabilities, built-in script language, MS Visio support and certainly free technical support.PDPC
ConceptDraw DIAGRAM extended with Seven Management and Planning Tools Solution from the Management Area of ConceptDraw Solution Park is the best software for drawing all types of diagrams from the Seven Management and Planning Tools: Affinity Diagram, Relations Diagram, Prioritization Matrix, Root Cause Analysis Tree Diagram, Involvement Matrix, PERT Chart, and Risk Diagram (PDPC).Is ConceptDraw DIAGRAM an Alternative to Microsoft Visio?
Visio for Mac and Windows - ConceptDraw as an alternative to MS Visio. ConceptDraw DIAGRAM delivers full-functioned alternative to MS Visio. ConceptDraw DIAGRAM supports import of Visio files. ConceptDraw DIAGRAM supports flowcharting, swimlane, orgchart, project chart, mind map, decision tree, cause and effect, charts and graphs, and many other diagram types.Business Calendar
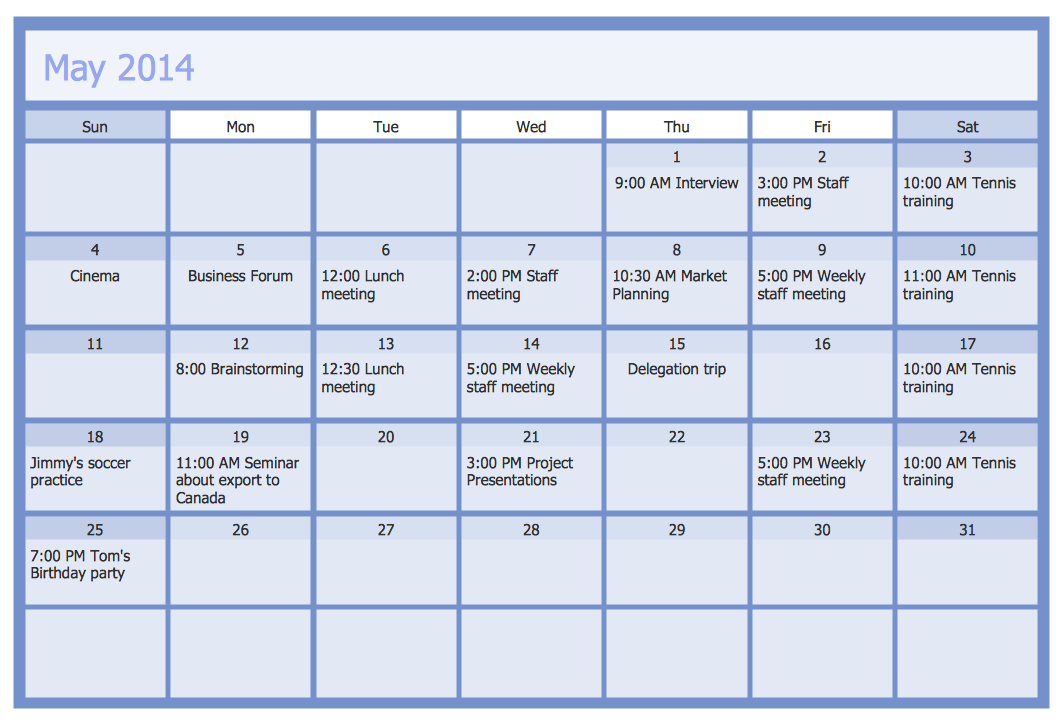
Business calendar is a special type of calendar, it must be functional, convenient for scheduling the affairs and meetings, and also must have strict, official and unobtrusive interface. So you must pay special attention to the business calendar design. Now you don't need to be an artist to design business calendar thanks to the unique drawing tools of Calendars Solution for ConceptDraw DIAGRAM diagramming and vector drawing software.Stakeholder Onion Diagram Template
For depicting the onion model are actively used Stakeholder Onion Diagrams. The ConceptDraw DIAGRAM diagramming and vector drawing software extended with Stakeholder Onion Diagrams Solution from the Management Area of ConceptDraw Solution Park offers the number of useful tools and Stakeholder Onion Diagram template for their easy design.- Bar Graph Of Economic Activities In Business
- The Best Drawing Program for Mac | Target Diagram | Economic ...
- Pie Chart Examples and Templates | Process Flowchart | Lean Six ...
- How To Make Simple Bar Diagram In Economics Step By Step
- Process Engineering | Flow chart Example. Warehouse Flowchart ...
- Economics Graph Maker Software Free Download
- Bar Chart Examples | Basic Bar Graphs | Bar Diagrams for Problem ...
- Economic Calendar | Bar Diagrams for Problem Solving. Create ...
- Process Flowchart | Pie Chart Examples and Templates | How to ...
- Economics Pictorial Chart
- Tree Chart Of Economic Planning
- Sector diagram - Template | How To Create Onion Diagram | Pie ...
- Bar Diagrams for Problem Solving. Create economics and financial ...
- Best Chart On Economics With Designs
- Bar Chart Examples | Bar Graph | Bar Diagram Math | Infrastructure ...
- Manufacturing 8 Ms fishbone diagram - Template | How Do ...
- Swim Lanes Flowchart. Flowchart Examples | Landscape ...
- Bar Diagrams for Problem Solving. Create economics and financial ...
- Process Flowchart | Pie Chart Examples and Templates | Social ...
- C4ISR architecture framework - IDEF0 activity diagram | Stakeholder ...


