Booch OOD Diagram
The vector stencils library Booch OOD from the solution Software Engineering contains specific symbols of the Booch method such as class symbols, association symbols, aggregation symbols for ConceptDraw DIAGRAM diagramming and vector drawing software. The Software Engineering solution is contained in the Software Development area of ConceptDraw Solution Park.Example of DFD for Online Store (Data Flow Diagram)
Data Flow Diagram (DFD) is a methodology of graphical structural analysis and information systems design, which describes the sources external in respect to the system, recipients of data, logical functions, data flows and data stores that are accessed. DFDs allow to identify relationships between various system's components and are effectively used in business analysis and information systems analysis. They are useful for system’s high-level details modeling, to show how the input data are transformed to output results via the sequence of functional transformations. For description of DFD diagrams are uses two notations — Yourdon and Gane-Sarson, which differ in syntax. Online Store DFD example illustrates the Data Flow Diagram for online store, the interactions between Customers, Visitors, Sellers, depicts User databases and the flows of Website Information. ConceptDraw DIAGRAM enhanced with Data Flow Diagrams solution lets you to draw clear and simple example of DFD for Online Store using special libraries of predesigned DFD symbols.
Organogram Software
Organizing process is the process of creating the organizational structure of an enterprise. The organizing process consists of several stages. First, you need to divide the organization into departments, respectively to strategies, and then establish relationships of authority. After that, managing director delegates his rights and authorities.Cisco Network Diagram Software
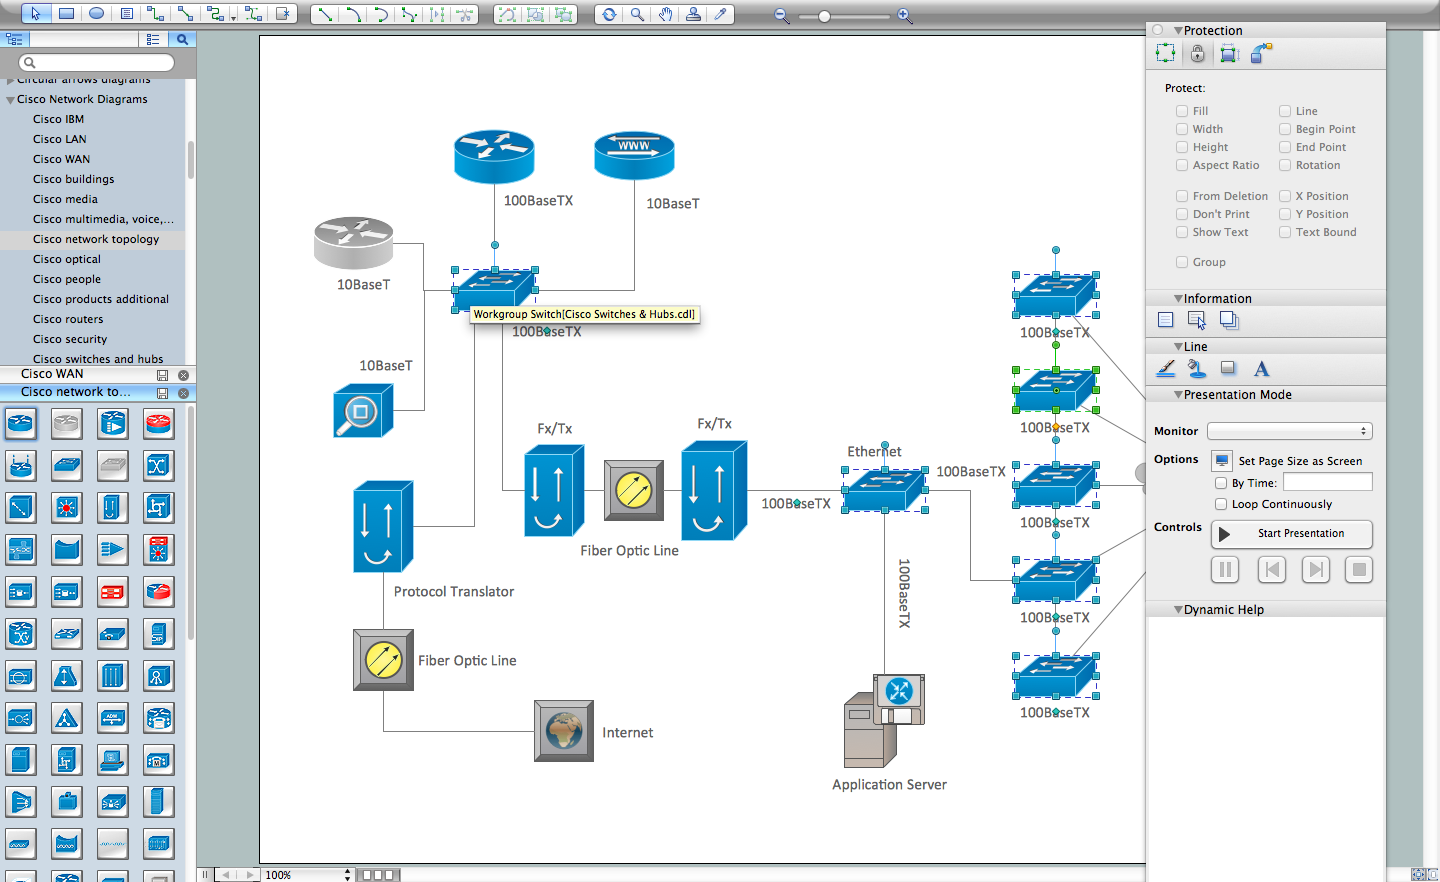
ConceptDraw DIAGRAM is the best network diagram software. To design the Cisco Network Diagrams and visualize the computer networks topology use ConceptDraw DIAGRAM diagramming and vector drawing software extended with Cisco Network Diagrams solution for ConceptDraw DIAGRAM Solution Park.Network Glossary Definition
The network glossary contains a complete list of network, computer-related and technical terms in alphabetic order, explanations and definitions for them, among them there are words well known for you and also specific, rare-used, uncommon or newly introduced terms. This specialized glossary, also known as a vocabulary, is the best in its field and covers in details the various aspects of computer network technologies. This glossary was developed by specialists using the practical experience and many useful sources to help the ConceptDraw users in their work, you can read and learn it from the screen on-line or print, it can be also used as a perfect educational guide or tutorial. ConceptDraw DIAGRAM software extended with Computer and Networks solution is easy to draw various types of Network diagrams, Network topology diagrams, Computer networking schematics, Network maps, Cisco network topology, Computer network architecture, Wireless networks, Vehicular networks, Rack diagrams, Logical, Physical, Cable networks, etc. Desktop ConceptDraw DIAGRAM Software is a good Visio for Mac Os X replacement. It gives you rich productivity and quality of the produced diagrams.
Accounting Flowchart Symbols
Accounting is a well known and popular tool used for gaining full quantitative information about the finances. The accounting process includes extensive set of activities that begins with transactions and ends with closing of books. It contains all financial information for a given organization, the data about incomes, expenditures, purchases, sales, return, payroll, and many other numerical information. The excellent possibility to create great-looking Accounting Flowcharts is offered by professional ConceptDraw DIAGRAM diagramming and vector drawing software. It includes the Accounting Flowcharts solution containing wide variety of predesigned accounting flowchart symbols. All symbols are easy recognizable, commonly used, vector and professionally designed, so are capable effectively save your time and efforts when representing all stages of accounting work process, the flow of data in an organization, accounting procedures and processes, documents, tasks, responsible people, users, components and authorizations.- UML Class Diagram Example - Medical Shop | Enterprise ...
- System Architecture For The Medical Store Management
- UML Class Diagram Example - Medical Shop | Booch OOD Diagram ...
- Example of DFD for Online Store (Data Flow Diagram) DFD ...
- Architectural Diagram For Medical Store
- UML Class Diagram Example - Medical Shop | UML Collaboration ...
- Data Flow Diagram For Medical Store Management
- UML Class Diagram Example - Medical Shop | UML Collaboration ...
- UML Class Diagram Example - Medical Shop | UML Notation | UML ...
- UML Class Diagram Example - Medical Shop | DFD Flowchart ...
- Store And Quality Diagram
- Computer Network Diagrams | Enterprise Architecture Diagrams ...
- UML Class Diagram Example - Medical Shop | State Diagram ...
- UML Class Diagram Example - Medical Shop | UML Collaboration ...
- Component Diagram In Uml For Shop System
- UML Class Diagram Example - Medical Shop | Example of DFD for ...
- UML Class Diagram Example - Medical Shop | Example of DFD for ...
- UML Class Diagram Example - Medical Shop
- Computer Network Diagrams | Enterprise Architecture Diagrams ...
- Example of DFD for Online Store (Data Flow Diagram) DFD ...


