 Area Charts
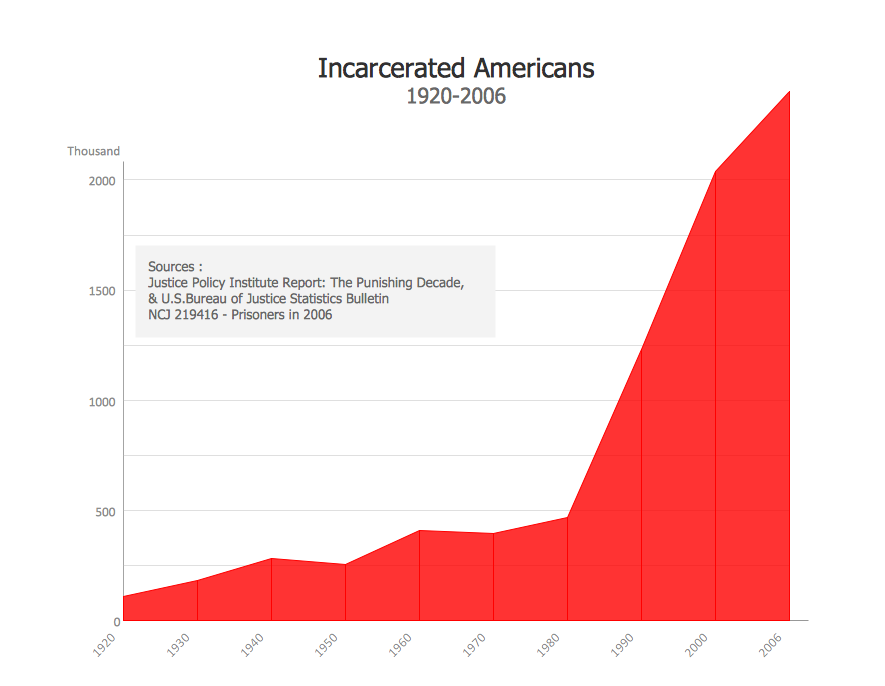
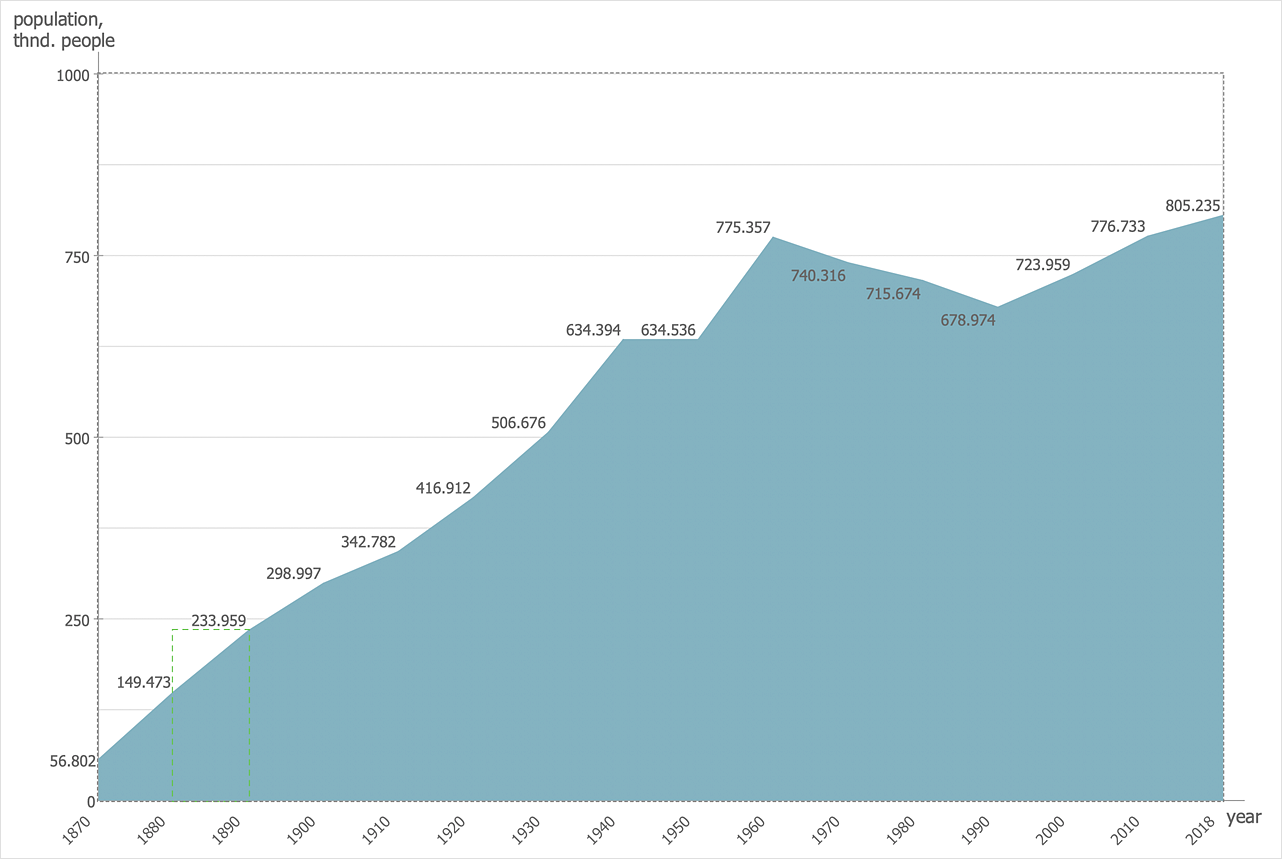
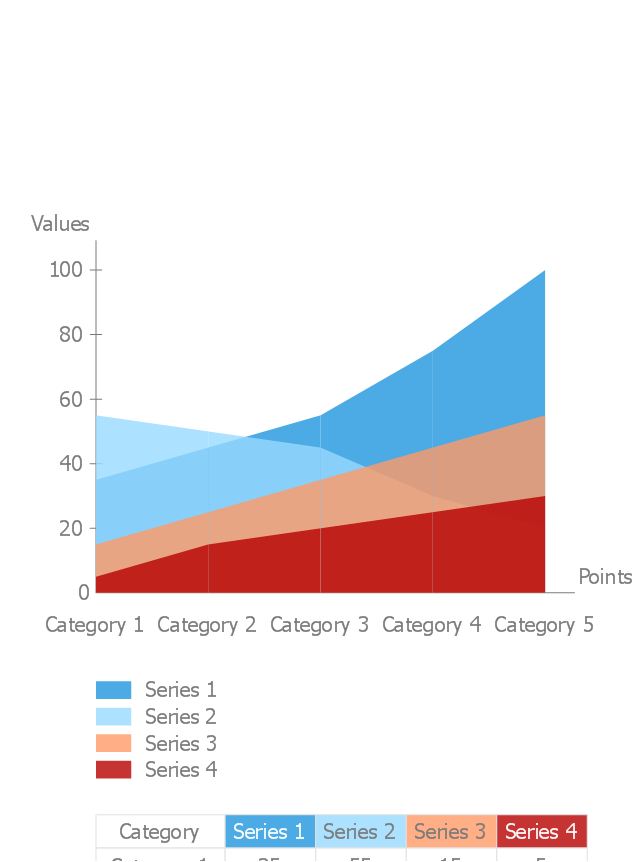
Area Charts are used to display the cumulative totals over time using numbers or percentages; or to show trends over time among related attributes. The Area Chart is effective when comparing two or more quantities. Each series of data is typically represented with a different color, the use of color transparency in an object’s transparency shows overlapped areas and smaller areas hidden behind larger areas.
 Basic Area Charts
This solution extends the capabilities of ConceptDraw DIAGRAM (or later) with templates, samples and a library of vector stencils for drawing Area Charts (area graphs) that visualize changes in values by filling in the area beneath the line connecting data points.
Area Charts
ConceptDraw DIAGRAM diagramming and vector drawing software extended with Area Charts solution from the Graphs and Charts area of ConceptDraw Solution Park is the best for drawing the Area Charts simply and fast.Area Chart
ConceptDraw DIAGRAM diagramming and vector drawing software offers the Area Charts solution from the Graphs and Charts area of ConceptDraw Solution Park for quick and easy drawing the Area Chart of any complexity.HelpDesk
How to Create a Basic Diagram Using Basic Charts Solutions
Creation of graphs or charts is the most used way of presenting information and data. The Basic Charts solution for ConceptDraw DIAGRAM is designed to assist you in drawing the most widely used kinds of charts. This solution provides a library of vector objects, comprised of such common diagrams as Line Chart, Area Chart, Histogram, Scatter Diagram, Pie Chart, Donut Chart, Column Chart, Horizontal Bar Chart. It also offers a set of typical examples of each of these charts.The vector stencils library "Area charts" contains 9 area chart templates you can drag into your document and set data by numbers entering or moving control dots. Use these templates to draw your area graphs in the ConceptDraw PRO diagramming and vector drawing software.
The vector stencils library "Area charts" is included in the Area Charts solution from the Graphs and Charts area of ConceptDraw Solution Park.
The vector stencils library "Area charts" is included in the Area Charts solution from the Graphs and Charts area of ConceptDraw Solution Park.
Basic Diagramming
Create flowcharts, org charts, shipping flowcharts, floor plans, business diagrams and more with ConceptDraw. Includes 1000s of professional-looking business templates that you can modify and make your own.
 Pie Charts
Pie Charts are extensively used in statistics and business for explaining data and work results, in mass media for comparison (i.e. to visualize the percentage for the parts of one total), and in many other fields. The Pie Charts solution for ConceptDraw DIAGRAM offers powerful drawing tools, varied templates, samples, and a library of vector stencils for simple construction and design of Pie Charts, Donut Chart, and Pie Graph Worksheets.
 Basic Pie Charts
This solution extends the capabilities of ConceptDraw DIAGRAM (or later) with templates, samples, and a library of vector stencils for drawing pie and donut charts.
 Network Layout Floor Plans
Network Layout Floor Plans solution extends ConceptDraw DIAGRAM software functionality with powerful tools for quick and efficient documentation the network equipment and displaying its location on the professionally designed Network Layout Floor Plans. Never before creation of Network Layout Floor Plans, Network Communication Plans, Network Topologies Plans and Network Topology Maps was not so easy, convenient and fast as with predesigned templates, samples, examples and comprehensive set of vector design elements included to the Network Layout Floor Plans solution. All listed types of plans will be a good support for the future correct cabling and installation of network equipment.
 Computer and Networks Area
The solutions from Computer and Networks Area of ConceptDraw Solution Park collect samples, templates and vector stencils libraries for drawing computer and network diagrams, schemes and technical drawings.
Local area network (LAN). Computer and Network Examples
Local Area Network (LAN) is a network which consists of computers and peripheral devices connected each other and to the local domain server, and covers a little territory or small number of buildings, such as home, school, laboratory, office, etc. LAN serves for few hundreds of users. It includes many cables and wires, and demands to design previously a Network diagram. All local area network devices can use the shared printers and disk storage. ConceptDraw DIAGRAM is a perfect network diagramming software with examples of LAN Diagrams, templates and predesigned vector objects. ConceptDraw DIAGRAM is the ideal choice for network engineers and network designers who need to draw fast and easy Local Area Network Diagrams, for IT specialists, developers and other IT professionals which need to visualize the communication schemes of LAN and visually document the LAN's physical structure and arrangement in houses, offices and other buildings. Ready-to-use vector objects from Computer Network Diagrams solution will help you design LAN diagrams in minutes.
Metropolitan area networks (MAN). Computer and Network Examples
A Metropolitan Area Network (MAN) is a great computer network located on the large geographical area or region. It is a network bigger than Local Area Network (LAN), but territorially smaller than Wide Area Network (WAN), its diameter usually ranges from 5 to 50 kilometers. MAN usually includes several buildings or even the whole city (metropolis). It is based on high data rate compounds using the fiber channels and other digital data transmission channels. MAN includes a lot of communicating devices, for its construction are used multiple routers, switches and hubs. MAN can combine together several Local Area Networks or Campus Area Networks located in different buildings within a city and provides the Internet connectivity for them. Solutions included to Computer and Networks Area for ConceptDraw Solution Park are the real godsend for those who want design Computer Network Diagrams, and among others the Metropolitan Area Network Diagrams. They offer the libraries with ready-to-use vector design elements, professional-looking examples, samples and templates.
Multiprotocol Label Switching (MPLS). Computer and Network Examples
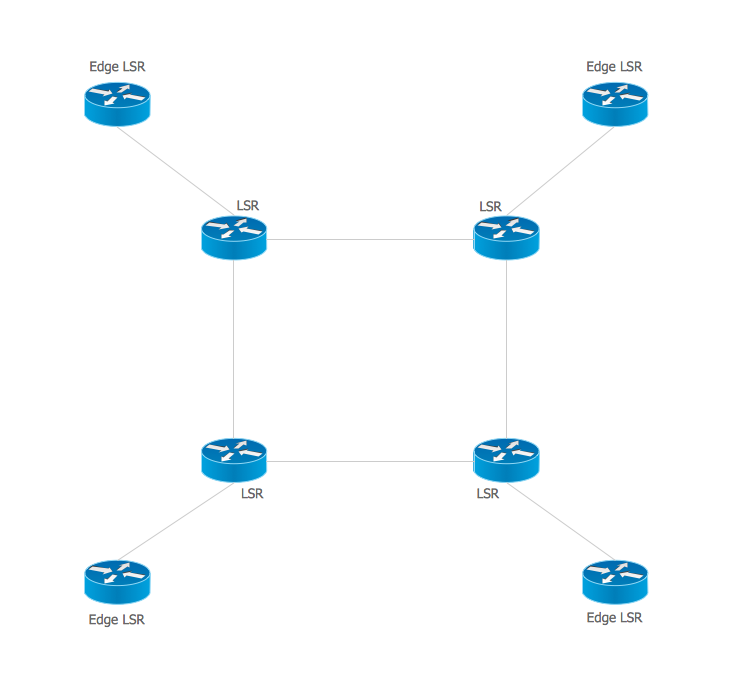
Multiprotocol Label Switching (MPLS) is a mechanism in high-performance telecommunication networks that implements the data transfer from one network node to another using the labels. ConceptDraw DIAGRAM is a powerful network diagramming and vector drawing software that provides the Computer and Networks solution with wide set of ready-to-use predesigned vector stencils and examples to help you design the MPLS Networks quick and easy.
 Organizational Charts
Organizational Charts solution extends ConceptDraw DIAGRAM software with samples, templates and library of vector stencils for drawing the org charts.
Gantt chart examples
All Gantt charts were made using ConceptDraw PROJECT. ConceptDraw PROJECT works both on Windows and Mac OS X. It allows to schedule a voluntary number of projects in a single Workspace document and lets easily share tasks and resources among them. ConceptDraw PROJECT shares files among Windows and Mac OS X.
 Frequency Distribution Dashboard
Frequency distribution dashboard solution extends ConceptDraw DIAGRAM software with samples, templates and vector stencils libraries with histograms and area charts for drawing the visual dashboards showing frequency distribution of data.
- Diagram Of Area Chart In Computer
- Area Charts | IDEF1X Standard | Area Charts | Comrcial Chart In ...
- Computer Network Diagrams | Basic Network Diagram | Cisco ...
- Basic Area Charts | Diagram Of Areachart In Computer
- Cisco Network Templates | Basic Area Charts | Network Diagram ...
- Design elements - Area charts | Area Charts | Basic Area Charts ...
- Computer and Networks Area | Basic Area Charts | Chart Maker for ...
- Storage area networks (SAN). Computer and Network Examples ...
- Storage area networks (SAN). Computer and Network Examples ...
- CS Odessa Announces Additions to Powerful Graphs and Charts ...
- Stakeholder Onion Diagrams | Divided Bar Diagrams | Area Charts ...
- Diagram of a Basic Computer Network. Computer Network Diagram ...
- Computer Network Diagrams | Metropolitan area networks (MAN ...
- Design elements - Area charts | Basic Area Charts | Area Chart ...
- Barrie population - Picture bar graph | Computer and Internet use at ...
- Process Flowchart | Area Charts | How to Draw an Area Chart in ...
- Computer and Networks Area | SWOT Sample in Computers ...
- Object-Oriented Design | Basic Area Charts | Star Network Topology ...
- Picture graphs - Vector stencils library | Area Charts | Production of ...
- Classroom Seating Chart | Presentation | Local area network (LAN ...


-area-charts---vector-stencils-library.png--diagram-flowchart-example.png)
-area-charts---vector-stencils-library.png--diagram-flowchart-example.png)
-area-charts---vector-stencils-library.png--diagram-flowchart-example.png)
-area-charts---vector-stencils-library.png--diagram-flowchart-example.png)
-area-charts---vector-stencils-library.png--diagram-flowchart-example.png)
-area-charts---vector-stencils-library.png--diagram-flowchart-example.png)
-area-charts---vector-stencils-library.png--diagram-flowchart-example.png)
-area-charts---vector-stencils-library.png--diagram-flowchart-example.png)


