Fishbone Diagram Procedure
ConceptDraw DIAGRAM diagramming and vector drawing software enhanced with Fishbone Diagrams solution from the Management area of ConceptDraw Solution Park gives the ability to draw Fishbone diagram, which identifies many possible causes for an effect for problem solving. Fishbone Diagram procedure of creation includes the set of steps easy for execution in ConceptDraw DIAGRAM.How to Build a Flowchart
The ConceptDraw DIAGRAM is a professional software for quick creating great looking flowcharts. The vector stencils from object libraries allows you to use RapidDraw technology. By the clicking on direction arrows one can add new object to flowcharts. This technology gives to users the ability to fast creating visualization for the structural data. Learn the basics of flowcharting and see how to build create a flowchart using ConceptDraw automatic drawing tools.Diagramming tool - Amazon Web Services and Cloud Computing Diagrams
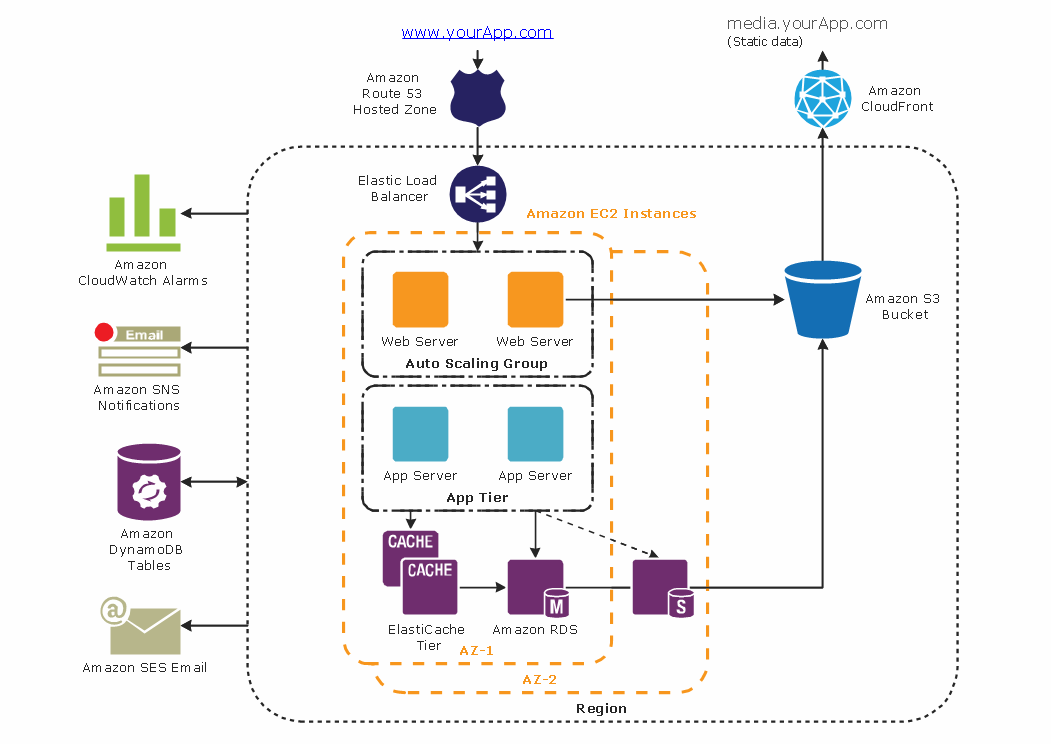
The AWS Architecture Diagrams solution includes icons, sample and templates for several Amazon Web Services products and resources, to be used when creating architecture diagrams. The icons are designed to be simple so that you can easily incorporate them in your diagrams and put them in your whitepapers, presentations, datasheets, posters or any technical material you like.Scrum process work items and workflow
Teams working with Scrum methodology use the product backlog items (PBIs), bug work item types (WITs), reports and dashboards. SCRUM Workflow solution for ConceptDraw DIAGRAM software offers collection of samples, variety of predesigned objects, clipart and graphic elements, a set of Scrum process work items and workflow which are developed for agile teams working using Scrum.Donut Chart Templates
These donut chart templates was designed using ConceptDraw DIAGRAM diagramming and vector drawing software extended with Pie Charts solution from Graphs and Charts area of ConceptDraw Solution Park. All these donut chart templates are included in the Pie Charts solution. You can quickly rework these examples into your own charts by simply changing displayed data, title and legend texts.Good Flow Chart app for Mac
The ConceptDraw DIAGRAM is a good flow chart app for Mac. Numerous vector stencils, samples and templates created by designers allows you to draw any type of flowchart.3-4 Defense Diagram
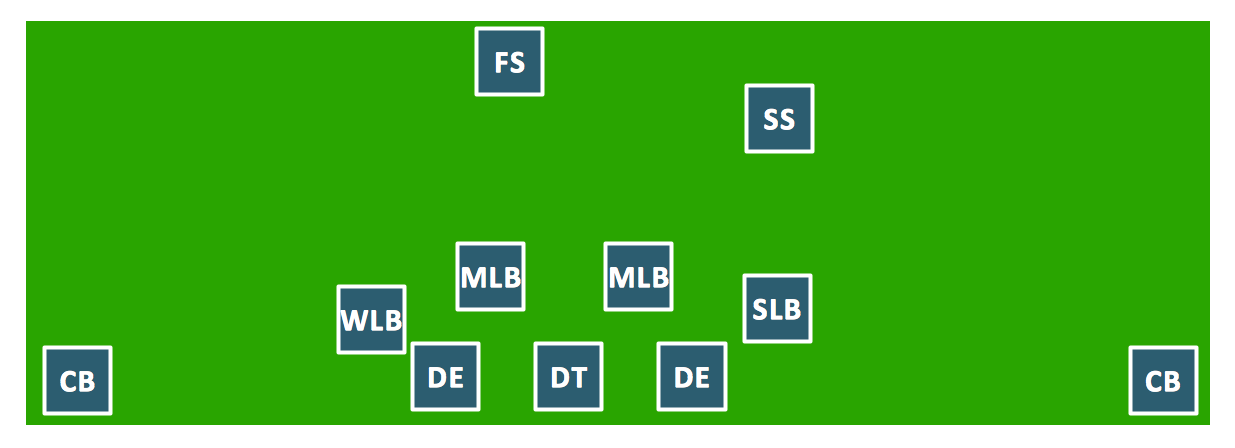
To be an expert in American Football this is not enough to know rules, you should also know at least basic offenses and defenses. Getting closer with this kind of knowledge you may find visual football diagrams an extremely helpful. The Football solution for ConceptDraw DIAGRAM gives you a perfect tool for drawing football diagrams.
 Fishbone Diagrams
The Fishbone Diagrams solution extends ConceptDraw DIAGRAM software with the ability to easily draw the Fishbone Diagrams (Ishikawa Diagrams) to clearly see the cause and effect analysis and also problem solving. The vector graphic diagrams produced using this solution can be used in whitepapers, presentations, datasheets, posters, and published technical material.
Draw Fishbone Diagram on MAC Software
The problem solving and decision-making processes are closely linked and crucial for the business and life. There are many tools and techniques for facilitating and improvement these processes, and also enhancement the quality of accepted decisions. One of them is Fisbone Diagram or Cause and Effect diagram. For its construction, you need first define the problem which you need to solve (existing or potential), write it into rectangular and draw to it a horizontal line - a “fish spine”. Then define general types of possible causes like Persons, Materials, Methods, Machinery, Measurements or Environment, and attach them to “spine”. Start brainstorming the possible reasons of failure and connect them to the branches. Professional diagramming ConceptDraw DIAGRAM MAC OSX software offers the Fishbone Diagrams solution which contains templates, samples, and ready Fishbone design objects. Use of them lets effectively identify the possible causes for an effect, realize successfully cause and effect analysis, and instantly draw Fishbone diagram on Mac software.How to Create Flowcharts for an Accounting Information System
Accounting information is a system of interrelated processes which represent financial and accounting data, required for decision making. For representing the accounting processes in a visual and easy for perception form are constructed Accounting Flowcharts. For their creation are used special flowchart symbols, this makes Accounting flowcharts understandable for all users of accounting information system and helps them easy understand the sequence of steps involved to accounting processes. But how to create Flowcharts for an Accounting Information System fast and easy? Use of special design software is useful for this. ConceptDraw DIAGRAM software extended with Accounting Flowcharts solution is the best for creation accurate Accounting Flowcharts, for documentation and visually communication on how accounting processes work, how each operation is done. Accounting Flowcharts solution is supplied with library of predesigned commonly used vector symbols, Accounting Flowchart templates and samples demonstrating receiving, purchasing, payment, and other accounting processes.- How To Draw A Network Diagram In Bitmap
- Professions - Vector stencils library | Presentation Clipart ...
- Professions - Vector stencils library | Rack diagrams - Vector stencils ...
- What's New in the Latest Update of ConceptDraw PRO?
- The value of the French franc in 2007 Euros | DroidDia prime ...
- Professions - Vector stencils library | Line graphs - Vector stencils ...
- Food Court | Cafe and Restaurant Floor Plans | Professions - Vector ...
- Design elements - Aircraft | Professions - Vector stencils library ...
- 3 Circle Venn Diagram. Venn Diagram Example | Professions ...
- Transit map template | Transport map - Template | Metro Map ...


