 Presentation Clipart
Presentation design elements solution extends ConceptDraw DIAGRAM software with slide samples, templates and vector stencils libraries with design elements of presentation symbols, arrows, callouts, backgrounds, borders and frames, title blocks.
 Illustration
This solution extends ConceptDraw DIAGRAM.4, allowing you to make professional-looking documents, presentations and websites illustrated with color, scalable vector clip art and shapes, regardless of drawing skills.
Bubble diagrams in Landscape Design with ConceptDraw DIAGRAM
Bubble Diagrams are the charts with a bubble presentation of data with obligatory consideration of bubble's sizes. They are analogs of Mind Maps and find their application at many fields, and even in landscape design. At this case the bubbles are applied to illustrate the arrangement of different areas of future landscape design, such as lawns, flowerbeds, playgrounds, pools, recreation areas, etc. Bubble Diagram helps to see instantly the whole project, it is easy for design and quite informative, in most cases it reflects all needed information. Often Bubble Diagram is used as a draft for the future landscape project, on the first stage of its design, and in case of approval of chosen design concept is created advanced detailed landscape plan with specification of plants and used materials. Creation of Bubble Diagrams for landscape in ConceptDraw DIAGRAM software is an easy task thanks to the Bubble Diagrams solution from "Diagrams" area. You can use the ready scanned location plan as the base or create it easy using the special ConceptDraw libraries and templates.
 Circular Arrows Diagrams
Circular Arrows Diagrams solution extends ConceptDraw DIAGRAM with extensive drawing tools, predesigned samples, Circular flow diagram template for quick start, and a library of ready circular arrow vector stencils for drawing Circular Arrow Diagrams, Segmented Cycle Diagrams, and Circular Flow Diagrams. The elements in this solution help managers, analysts, business advisers, marketing experts, scientists, lecturers, and other knowledge workers in their daily work.
HelpDesk
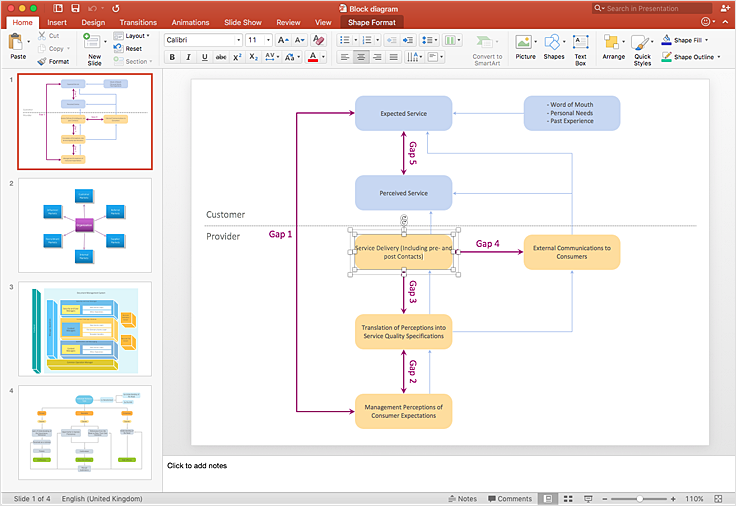
How to Add a Block Diagram to a PowerPoint Presentation
A block diagram is a useful tool both in designing new processes, and in improving existing. A block diagram is a type of chart, which is often used in presentations, because of its universality - the graphic blocks can be applied to many processes.The PowerPoint presentation of major process steps and key process participants can be very informative and helpful. Using ConceptDraw DIAGRAM , you can easily convert a block diagram to MS PowerPoint presentation.- Presentation Clipart | Presentation design elements - Vector clipart ...
- Arrows - Vector clipart library | Design elements - Arrows ...
- Arrows - Vector clipart library | HR arrows - Vector stencils library ...
- Presentation Clipart | Business People Clipart | Arrows - Vector ...
- Arrows - Vector clipart library | Illustration | Presentation Clipart | Up ...
- Arrows - Vector clipart library | Presentation Clipart | Illustration ...
- Arrow Design On Mind Map
- Presentation Clipart | Holiday | Business People Clipart | Solution ...
- Presentation design elements - Vector clipart library | Presentation ...
- Winter Sports Vector Clipart. Medal Map. Spatial Infographics ...
- Presentation Clipart | Holiday | Illustration | Solution Clipart
- Circular Arrow Template
- Vector Arrows Architecture
- How to Draw a Circular Arrows Diagram Using ConceptDraw PRO ...
- Presentation Clipart | Business People Clipart | Advertising - Design ...
- Basic Flowchart Symbols and Meaning | Circular Arrow ...
- Circular Flow Diagram Template
- Circle Diagrams | Circle Spoke Diagram Template | 2 Circle Venn ...
- Presentation Clipart | Business People Clipart | Business - Design ...
- Mac Compatible Remote Presentation | Presentation Clipart ...

