 Circular Arrows Diagrams
Circular Arrows Diagrams solution extends ConceptDraw PRO v10 with extensive drawing tools, predesigned samples, Circular flow diagram template for quick start, and a library of ready circular arrow vector stencils for drawing Circular Arrow Diagrams, Segmented Cycle Diagrams, and Circular Flow Diagrams. The elements in this solution help managers, analysts, business advisers, marketing experts, scientists, lecturers, and other knowledge workers in their daily work.
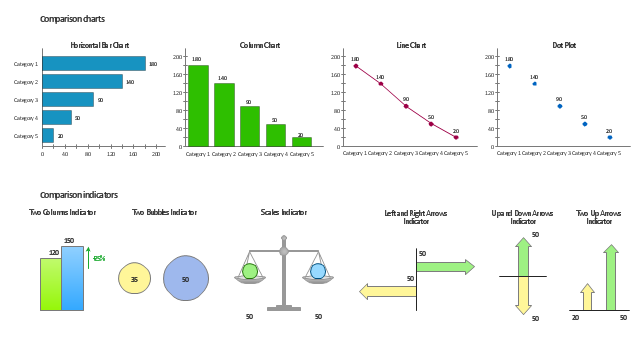
The vector stencils library Comparison charts contains 4 Live Objects: Horizontal bar chart, Column chart (Vertical bar chart), Line chart and Dot plot (Scatter chart).
The vector stencils library Comparison indicators contains 7 Live Objects:
Two column indicator, Two bubbles indicator, Scales indicator, Left and right arrows indicator, Up and down arrows indicator, Two up arrows indicator.
The ConceptDraw Live Objects are ready-to-use templates of charts and visual indicators for dashboard design. You can set data source file for Each Live Object, and your charts or indicators will represents actual data from the data source files, and change their appearance with changing of the data in source files. The comparison charts and indicators are useful to compare and rank of your data by categories.
Use the design elements libraries "Comparison charts" and "Comparison indicators" to create your own business visual dashboards using the ConceptDraw PRO diagramming and vector drawing software.
The example "Design elements - Comparison charts and indicators" is included in the Comparison Dashboard solution from the area "What is a Dashboard" of ConceptDraw Solution Park.
HelpDesk
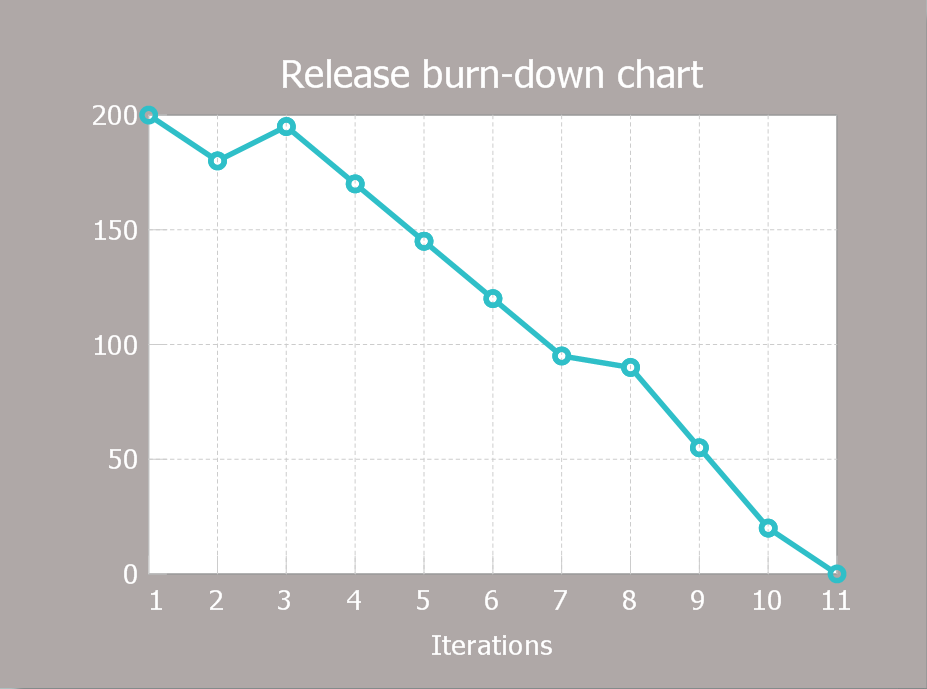
How to Create a Release Burn-Down Chart Using ConceptDraw PRO
The Agile methodology provides project teams the ability to quickly adapt the project to the current situation and thus achieve maximum productivity. According the Scrum method the steps needed to fulfill the project goal breaks down by using short sprints or iterations. The iterations together with an extensive collaboration can increase productivity by better understanding the entire flow of a project. A release burn-down chart is used to track a progress on a Scrum project. The ConceptDraw Scrum Workflow Solution makes it easy for Agile project team to build any professional Scrum diagram such as a Release velocity chart, Release burn-down chart, Sprint burn-down chart, or a Team velocity chart.
 Comparison Dashboard
Comparison dashboard solution extends ConceptDraw PRO software with samples, templates and vector stencils library with charts and indicators for drawing the visual dashboard comparing data.
Chore charts with ConceptDraw PRO
Chore chart. Draw perfect-looking chore chart. Free chore chart samples. All about chore charts.- Arrows Bar Chart
- Basic Line Graphs | GHS Hazard Pictograms | Arrows - Vector clipart ...
- Circular Flow Diagram Template
- How to Draw a Circular Arrows Diagram Using ConceptDraw PRO ...
- Circular diagrams - Vector stencils library | Circular arrows diagrams ...
- Basic Flowchart Symbols and Meaning | Circular arrows diagrams ...
- 3d Circular Arrows
- HR arrows - Vector stencils library | UML Component Diagram ...
- Image Of Back Arrow
- Circular Flow Diagram Template | Circular Arrows Diagrams ...
- Circular Arrows Diagrams | Basic Flowchart Symbols and Meaning ...
- Bio Flowchart Lite | Presentation Clipart | Arrows - Vector clipart ...
- 3d Arrows
- Entity Relationship Diagram Symbols | ERD Symbols and Meanings ...
- Line Segment Arrow
- Innovation life cycle - Arrow loop diagram | Circular arrows diagram ...
- How to Draw a Circular Arrows Diagram Using ConceptDraw PRO ...
- Sales arrows - Vector stencils library | Scrum process work items ...
- Circular Arrow Shape
- Png Image Arrow


