Basic Flowchart Symbols and Meaning


DFD Flowchart Symbols

Value Stream Mapping Symbols

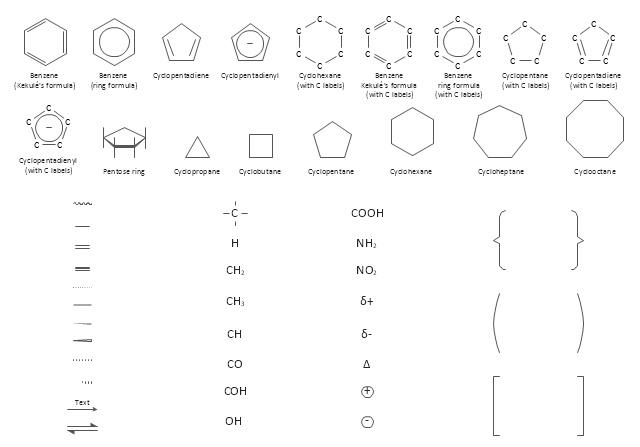
The vector stencils library "Chemical drawings" contains 81 symbols of organic compounds and functional groups for chemical drawing.
Use it to draw structural formulas of organic molecules, schemes of chemical reactions and organic chemistry diagrams.
"Structural drawings.
Organic molecules are described more commonly by drawings or structural formulas, combinations of drawings and chemical symbols. The line-angle formula is simple and unambiguous. In this system, the endpoints and intersections of each line represent one carbon, and hydrogen atoms can either be notated explicitly or assumed to be present as implied by tetravalent carbon. The depiction of organic compounds with drawings is greatly simplified by the fact that carbon in almost all organic compounds has four bonds, nitrogen three, oxygen two, and hydrogen one. ...
Organic reactions.
Organic reactions are chemical reactions involving organic compounds. While pure hydrocarbons undergo certain limited classes of reactions, many more reactions which organic compounds undergo are largely determined by functional groups. The general theory of these reactions involves careful analysis of such properties as the electron affinity of key atoms, bond strengths and steric hindrance. These issues can determine the relative stability of short-lived reactive intermediates, which usually directly determine the path of the reaction.
The basic reaction types are: addition reactions, elimination reactions, substitution reactions, pericyclic reactions, rearrangement reactions and redox reactions. ...
Each reaction has a stepwise reaction mechanism that explains how it happens in sequence - although the detailed description of steps is not always clear from a list of reactants alone.
The stepwise course of any given reaction mechanism can be represented using arrow pushing techniques in which curved arrows are used to track the movement of electrons as starting materials transition through intermediates to final products." [Organic chemistry. Wikipedia]
The chemical symbols example "Design elements - Chemical drawings" was created using the ConceptDraw PRO software extended with the Chemistry solution from the Science and Education area of ConceptDraw Solution Park.
Chemical symbols
DFD Library — Design elements

Flow Map

Garrett IA Diagrams with ConceptDraw PRO

HelpDesk
How to Add a Block Diagram to a PowerPoint Presentation

Types of Flowcharts


Diagramming Software for Business Process
")

How tо Represent Information Graphically

Workflow Diagram Data

IDEF0 Diagram

HR Management Software

- Water cycle diagram | Strategic planning - Cycle diagram ...
- Chemistry Equation Symbols | Chemistry Drawing Software ...
- Quality Management System | Water cycle diagram | Organizational ...
- Program to Make Flow Chart | BPR Diagram. Business Process ...
- What is the Accounting Cycle? | Steps of Accounting Cycle ...
- Diagramming tool - Amazon Web Services and Cloud Computing ...
- Chemistry Equation Symbols | Design elements - Chemical ...
- Proton-proton chain reaction diagram | BPR Diagram. Business ...
- Windows Vista graphic user interface - Template | Interactions ...
- Chemistry Drawings | Chemistry | Chemistry Drawing Software ...
- Transport - Template | Flow Chart for Olympic Sports | PM Planning ...
- Mechanical Drawing Symbols | Building Plans with ConceptDraw ...
- Water cycle diagram | Entity-Relationship Diagram (ERD) | LLNL ...
- Process Flow Diagram Symbols | Design elements - HVAC control ...
- Basic Flowchart Symbols and Meaning | Flowchart Definition | Flow ...
- Types of Flowchart - Overview | Basic Flowchart Symbols and ...
- Design elements - Chemical drawings | Chemistry | Carbonyl ...
- Water cycle diagram | Flow Chart Creator | Push Notification ...
- Organic Chemistry Symbols | Chemistry Symbols and Meanings ...
- Design elements - Pneumatic pumps and motors | Pneumatic 5 ...