DroidDia prime
Droiddia allows you to make flow charts org charts venn diagrams mindmaps and do other diagrams with no constrains and as little effort as possible.
 Pie Charts
Pie Charts are extensively used in statistics and business for explaining data and work results, in mass media for comparison (i.e. to visualize the percentage for the parts of one total), and in many other fields. The Pie Charts solution for ConceptDraw PRO v10 offers powerful drawing tools, varied templates, samples, and a library of vector stencils for simple construction and design of Pie Charts, Donut Chart, and Pie Graph Worksheets.
HelpDesk
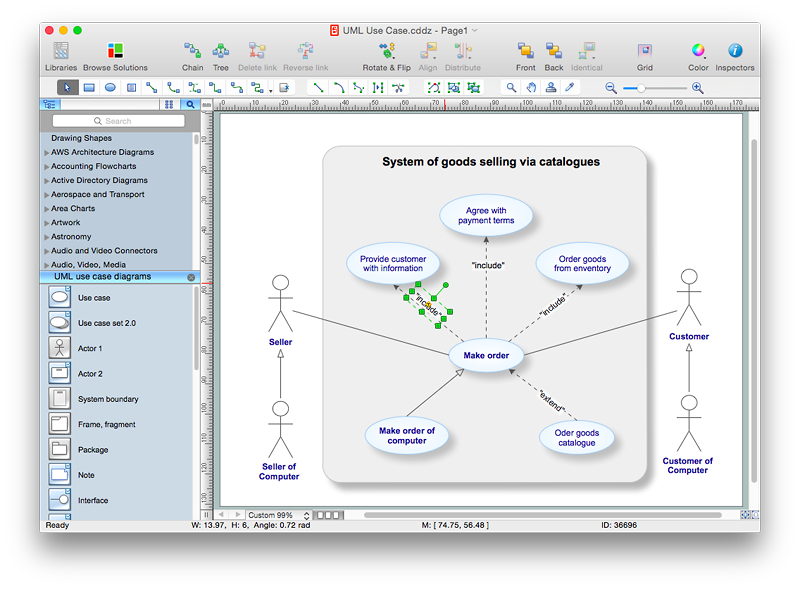
How to Add Text to a Connector in ConceptDraw PRO
The new ConceptDraw Arrows10 Technology is a powerful diagramming technique that powered the way business drawing created. ConceptDraw PRO gives you some tools for connecting shapes: Direct Connectors, Smart, Arc, Bezier, Curve and Round Connectors.Direct Connectors are direct lines from the point to the point. Smart , Arc, Bezier, Curve and Round Connectors are almost the same as Direct Connectors. However, they automatically move around other objects. You can use Chain, or Tree connection mode for connection of multiple objects with any type of connectors. ConceptDraw PRO allows you to add and move text on a connector the same way that you add and move text on other any object.
 iPhone User Interface
iPhone User Interface solution extends ConceptDraw PRO v10 software with templates, samples and libraries with large quantity of vector stencils of graphical user interface elements, Apps icons, UI patterns for designing and prototyping of the iOS applic
HelpDesk
How to Draw a Circular Arrows Diagram Using ConceptDraw PRO
The cyclic recurrence is a fundamental property of multiple systems. The cycle is a process which consists from elements (phases, stages, stages) following each other. Many processes in astronomy, biology, chemistry, physics, mathematics, etc. have a cycle properties. It is also widely used in information technologies and marketing analysis. Graphical representation of cyclic processes can have many forms. It can be a circle, parabola, hyperbola, ellipse and others. A Circular Arrows Diagram is used as one of the statistical charts in the business, mass media and marketing. ConceptDraw PRO provides its users tools for making easy drawing Circular Arrows Diagrams.Bio Flowchart Lite
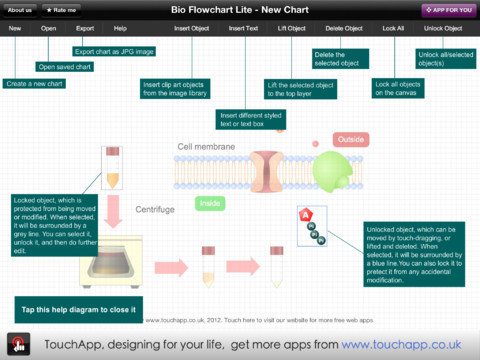
This app targets to help teachers and students to create vivid and professional biological flowcharts and diagrams in an easy way.- How to Build a Flowchart | Images Of Single Ribbon Design Png
- Png Image Arrow
- Blue Cross Arrows Png Images
- Different Arrows Png
- Gray Arrows Png Images
- Curved Arrow Png
- Double Headed Arrow Images
- Beautiful Arrow Png
- Drop Down Png Image
- Icon 2d Arrow Png
- Image Arrow For Presentation
- Images Of Long Arrows
- Arrows Images
- Bent Arrows Images
- Box Png Images
- Ventilation Arrow Png
- Curved Arrow Icon Png
- Arrow Flow Png
- How to Connect an Image to a Topic in Your Mind Map | Professions ...
- Vector Png Images
.jpg)


