Bubble diagrams in Landscape Design with ConceptDraw DIAGRAM
Bubble Diagrams are the charts with a bubble presentation of data with obligatory consideration of bubble's sizes. They are analogs of Mind Maps and find their application at many fields, and even in landscape design. At this case the bubbles are applied to illustrate the arrangement of different areas of future landscape design, such as lawns, flowerbeds, playgrounds, pools, recreation areas, etc. Bubble Diagram helps to see instantly the whole project, it is easy for design and quite informative, in most cases it reflects all needed information. Often Bubble Diagram is used as a draft for the future landscape project, on the first stage of its design, and in case of approval of chosen design concept is created advanced detailed landscape plan with specification of plants and used materials. Creation of Bubble Diagrams for landscape in ConceptDraw DIAGRAM software is an easy task thanks to the Bubble Diagrams solution from "Diagrams" area. You can use the ready scanned location plan as the base or create it easy using the special ConceptDraw libraries and templates.
 Sales Flowcharts
The Sales Flowcharts solution lets you create and display sales process maps, sales process workflows, sales steps, the sales process, and anything else involving sales process management.
HelpDesk
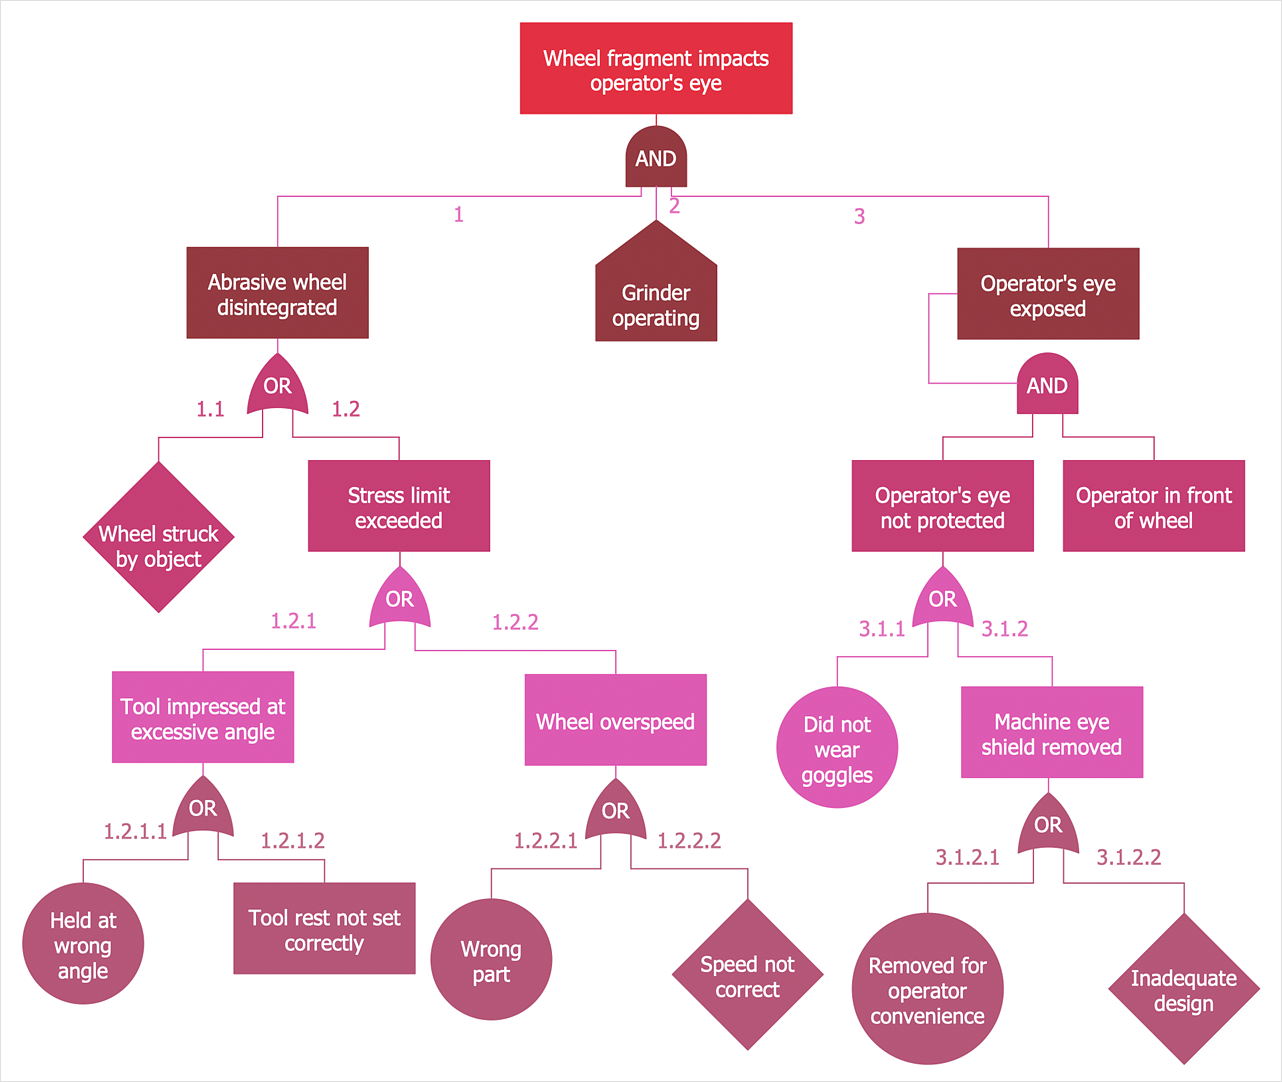
How to Create a Fault Tree Analysis Diagram (FTD)
Fault Tree Diagram is a logic diagram that shows the state of an entire system in a relationship of the conditions of its elements. Fault Tree Diagram is used to analyze the probability of functional system failures and safety accidents. ConceptDraw DIAGRAM allows you to create professional Fault Tree Diagrams using the basic FTD symbols. An FTD visualizes a model of the processes within a system that can lead to the unlikely event. A fault tree diagrams are created using standard logic symbols. The basic elements in a fault tree diagram are gates and events.HelpDesk
How to Draw a Circular Arrows Diagram
The cyclic recurrence is a fundamental property of multiple systems. The cycle is a process which consists from elements (phases, stages, stages) following each other. Many processes in astronomy, biology, chemistry, physics, mathematics, etc. have a cycle properties. It is also widely used in information technologies and marketing analysis. Graphical representation of cyclic processes can have many forms. It can be a circle, parabola, hyperbola, ellipse and others. A Circular Arrows Diagram is used as one of the statistical charts in the business, mass media and marketing. ConceptDraw DIAGRAM provides its users tools for making easy drawing Circular Arrows Diagrams.
 Basic Circular Arrows Diagrams
This solution extends ConceptDraw DIAGRAM (or later) with samples, templates, and a library of vector stencils for drawing circular arrow diagrams.
- Modern North Arrow Png
- USA Maps | Continent Maps | North Arrow Mark Png
- Modern Architectural North Arrow Png
- Arrow Artwork Png
- Wind Arrow Direction Png
- North Arrow Architecture Vector Png
- Right Arrow Sign Png
- Arrow Sign Png Diagram
- Continent Maps | North Mark Arrow For Architectural Drawings Png
- Architectural Wind Arrow Png
- Wind Direction Arrows Architecture Png
- Arrows Image Png For Photoshop
- Arrow Signs Png For Photoshop Plans
- North Arrow Architectural
- Arrow Double Head Png
- Png Of Wind Arrows
- North Arrow Architecture Png
- Physics Symbols | Physics | Sun Path Arrow Png
- Round Arrow Png
- Rounded Arrow Png


