HelpDesk
How to Draw a Circular Arrows Diagram Using ConceptDraw PRO
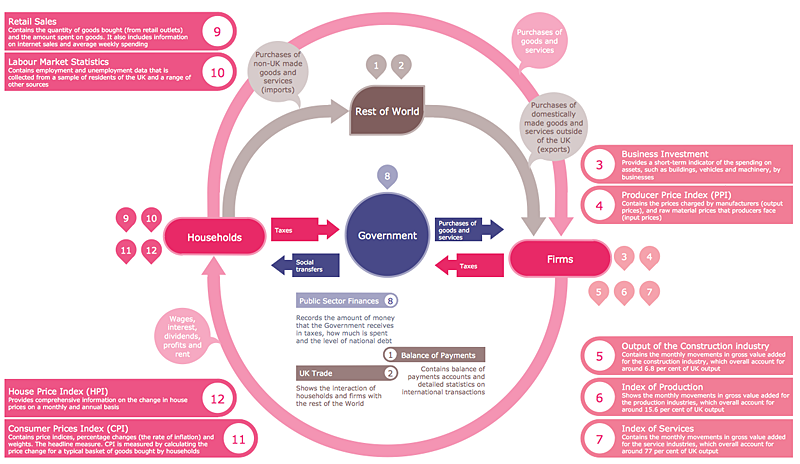
The cyclic recurrence is a fundamental property of multiple systems. The cycle is a process which consists from elements (phases, stages, stages) following each other. Many processes in astronomy, biology, chemistry, physics, mathematics, etc. have a cycle properties. It is also widely used in information technologies and marketing analysis. Graphical representation of cyclic processes can have many forms. It can be a circle, parabola, hyperbola, ellipse and others. A Circular Arrows Diagram is used as one of the statistical charts in the business, mass media and marketing. ConceptDraw PRO provides its users tools for making easy drawing Circular Arrows Diagrams.The vector stencils library "Circular diagrams" contains 42 templates of circular diagrams: circular arrow diagram, circular motion diagram, arrow ring chart, doughnut chart (donut chart), circle pie chart, diamond pie chart, circle diagram, pie chart, ring chart, loop diagram, block loop diagram, arrow loop circle, crystal diagram, triangular diagram, diamond diagram, pentagon diagram, hexagon diagram, heptagon diagram, cycle diagram (cycle chart), stacked Venn diagram (onion diagram), arrow circle diagram.
Use these shapes to illustrate your marketing and sales documents, presentations, webpages and infographics in the ConceptDraw PRO diagramming and vector drawing software extended with the Target and Circular Diagrams solution from the Marketing area of ConceptDraw Solution Park.
www.conceptdraw.com/ solution-park/ marketing-target-and-circular-diagrams
HelpDesk
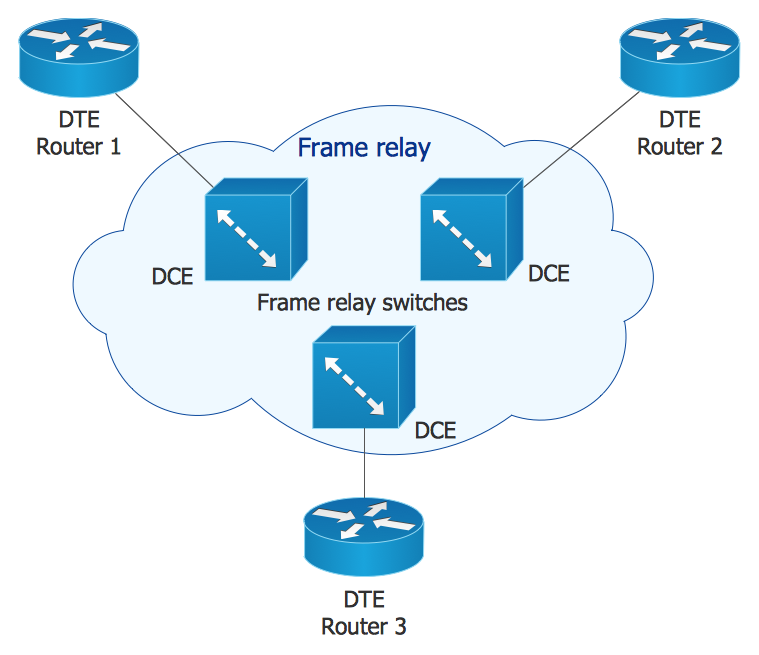
How to Create Cisco Network Diagram Using ConceptDraw Libraries
Cisco Network chart can be a great start for detailed network documentation, as well as serve as a visual instruction for new IT staff, or as a detailed illustration for a presentation. The easiest way to design Cisco Network diagram using standard Cisco product symbols is using ConceptDraw PRO powered by Cisco Network Diagrams solution. The Cisco Network Diagrams solution uses Cisco network symbols and icons to to visually document the Cisco network topology and design of Cisco network diagrams. Using ConceptDraw libraries you can access a wide array of Cisco network icons, so you can quickly prototype a new network or document an existing one.HelpDesk
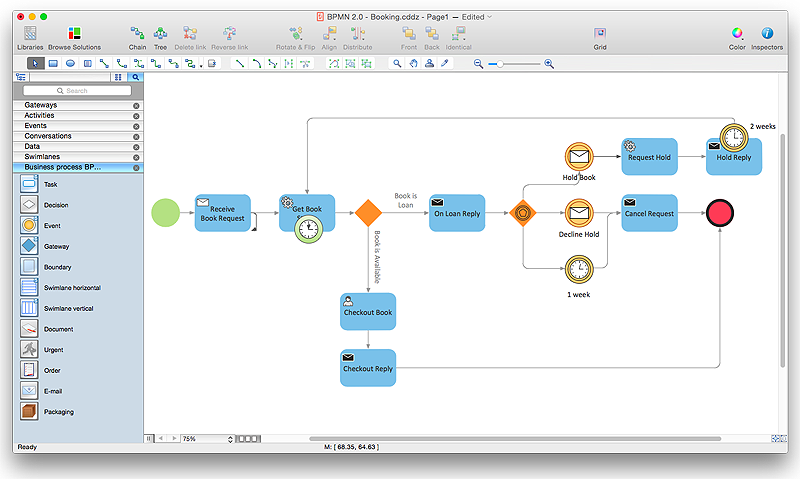
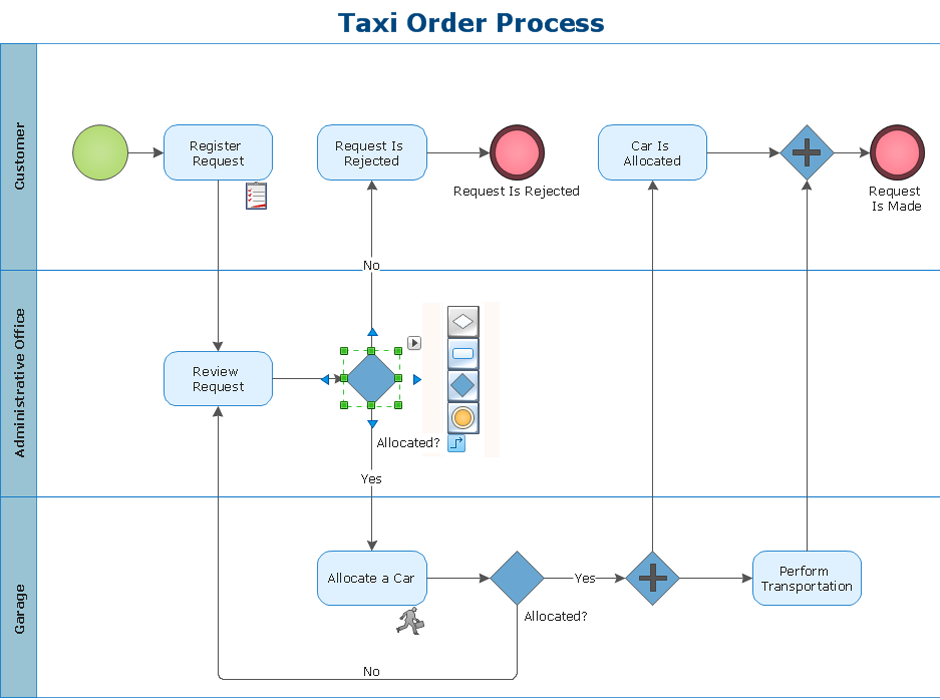
How to Create a BPMN Diagram Using ConceptDraw PRO
Business Process Modeling Notation (BPMN) is a method of illustrating business processes in the form of a diagram. The most effective method of creating or analyzing a business process is to visually interpret the steps using a business process diagram, flowchart or workflow. This is known as business process modeling, and will be performed within a company by a team who have detailed knowledge of company process, and analysts with expertise in the modeling discipline. The objective is often to increase production or lower costs — by modeling the process initially using a flowchart, inefficiencies and problems can be spotted before committing to a decision or strategy. You can create BPMN diagrams using the ConceptDraw PRO diagramming tools. ConceptDraw have designed a solution that combines BPMN v2.0 methodology and graphical notification into one powerful package. The Business Process Diagrams solution from ConceptDraw Solution Park provides a comprehensive collection of vectorHelpDesk
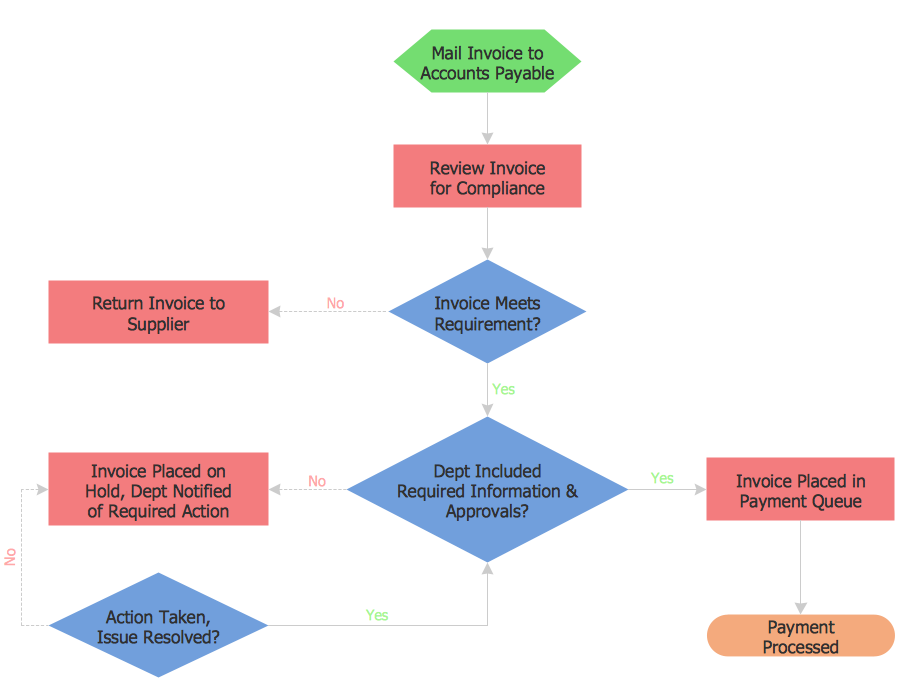
Software for Flowchart Diagrams
There are many types of flowcharts among them are work flow diagram, data flow diagram, business flow diagram and other very complex flowcharts. Thus to draw flowchart it is better to use computer program – a software for flowchart diagrams creation. The best flowchart software - is ConceptDraw PRO. With the help of ConceptDraw visual solutions, you can quickly and effortlessly portray even the most complex business process flow. ConceptDraw Flowchart solutions deliver a special set of vector stencils that contains all standard symbols of flowchart notation, and a large number of special symbols intended for business-oriented flowcharts.HelpDesk
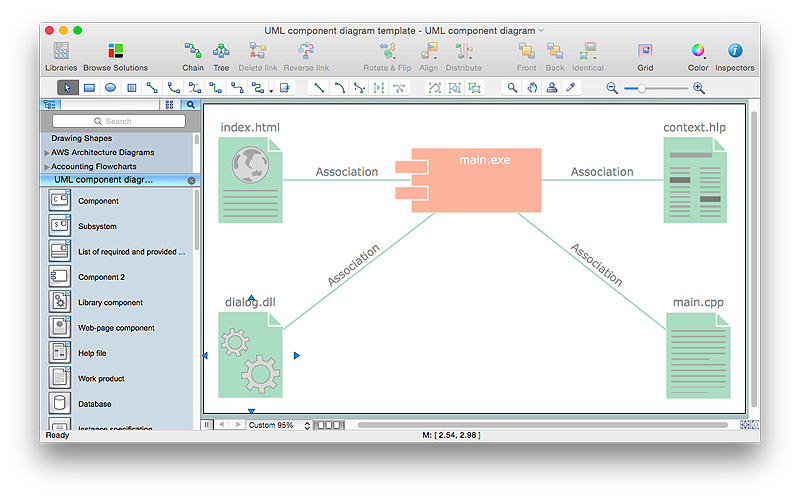
How to Create a UML Diagram Using ConceptDraw PRO
ConceptDraw PRO is a perfect tool to draw UML Diagrams.
 Stakeholder Onion Diagrams
The Stakeholder Onion Diagram is often used as a way to view the relationships of stakeholders to a project goal. A basic Onion Diagram contains a rich information. It shows significance of stakeholders that will have has influence to the success achieve
HelpDesk
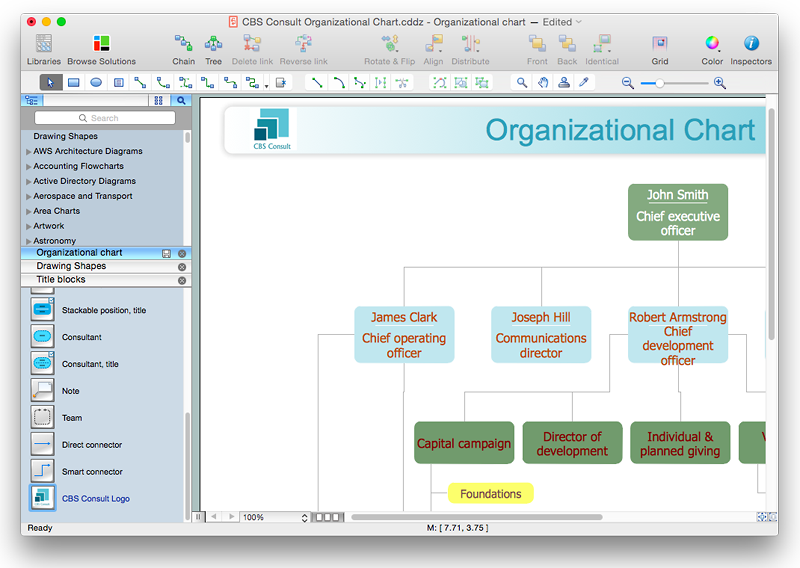
How to Add a Self-Drawn Object to any Library
One of the key elements of ConceptDraw PRO solutions are the libraries, containing a set of associated objects. Using these collections of business oriented vector objects, you can quickly get started making the diagram in the theme you need. The library collection can be supplemented by creating new or editing existing objects. You can create your own unique library just by dragging objects with the mouse. Library objects can be customized and saved for later use. You can change the scaling, color, line weight, label, and even the fill pattern of an object to use in custom drawings and diagrams. Your custom objects even can be searched for the next time you need to use them.HelpDesk
How to Make a Rapid Draw Object in ConceptDraw PRO
The Rapid Draw technology is an automatic drawing system. It is designed to significantly reduce the time of creating flowcharts and diagrams. Especially those, consisting from some typical entities. You can extend the standard ConceptDraw PRO object libraries with new objects by customizing any item from any library and assigning it with Rapid Draw features. You can quickly create and edit complex drawings using Rapid Draw technology and your self-created objects.HelpDesk
How to Create a Business Process Workflow Diagram Using ConceptDraw PRO
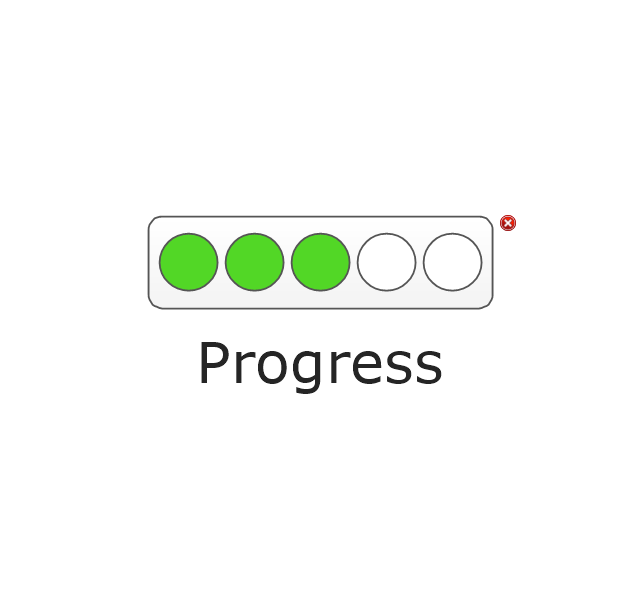
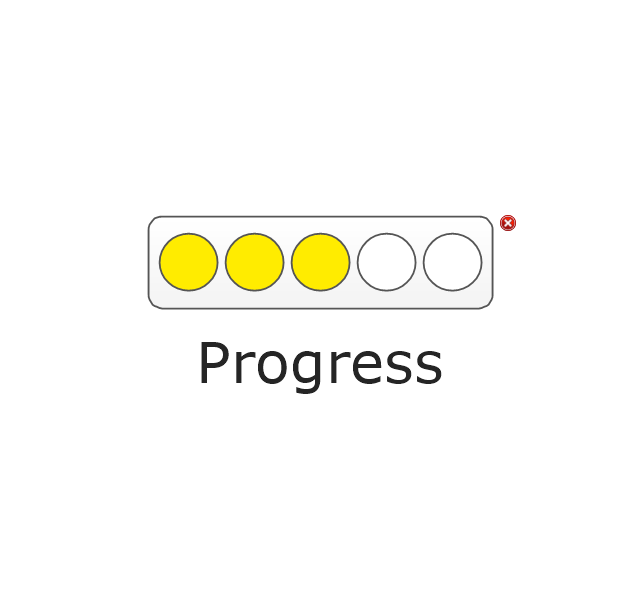
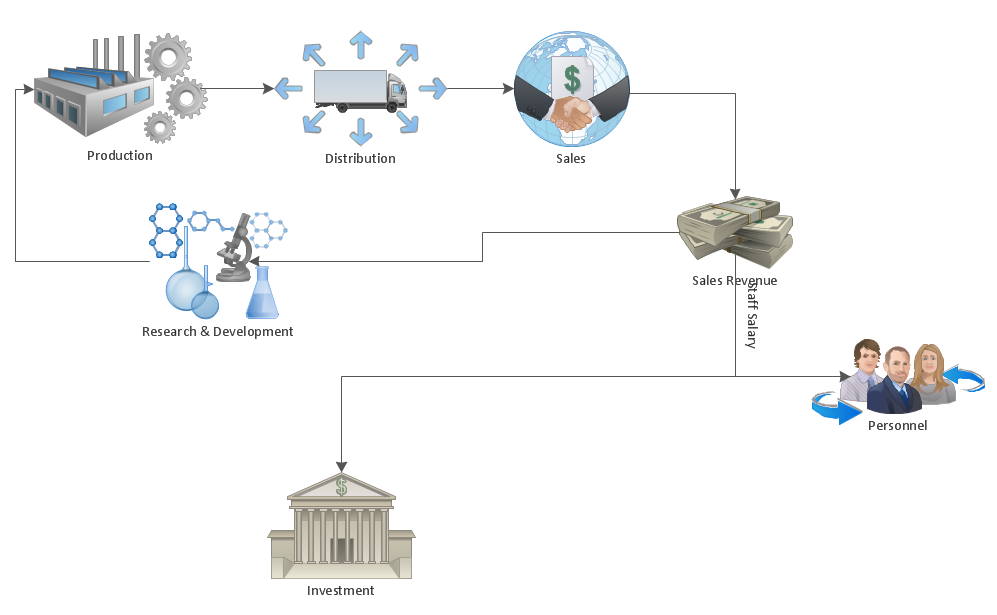
Any business process consists from a set of activities and tasks intended to accomplish a particular business objective. Making a business process workflow diagram is a visual way for business process analysis. Business process workflow diagram should show how various process participants interact with each other to accomplish business tasks and how the corresponding information flows through the business process stages. A business process workflow diagram can be in help when there is a need to improve the business process. It provides the clear vision on what steps, decisions or activities involved in a process need to be improved . The simplicity of business process workflow diagrams makes them useful tools for process communicating, documenting and guidance on how to do a particular work. ConceptDraw PRO, with the extended functionality of the Business Process Workflow Diagrams solution, is the ideal medium for creating designs of this type. Business Process The Workflow Diagrams solution contains the set of libraries that help to represent various steps and kinds of business processes.The vector stencils library "Status indicators" contains 41 visual status indicators. Each status indicator can visualize one of 2-6 information states and have a caption.
Use it to create your business performance dashboards in the ConceptDraw PRO diagramming and vector drawing software extended with the Status Dashboard solution from the area "What is a Dashboard" of ConceptDraw Solution Park.
Use it to create your business performance dashboards in the ConceptDraw PRO diagramming and vector drawing software extended with the Status Dashboard solution from the area "What is a Dashboard" of ConceptDraw Solution Park.
HelpDesk
How to Make a Workflow Diagram Using ConceptDraw PRO
With the help of a workflow diagram you can visually describe the tasks, documents, people responsible for execution at each stage of workflow. Modern workflow diagrams have a specific focus on quality control. This can apply to the quality of inputs and outputs related to a process, or to the actual efficiency of the workflow itself. Different sectors of business use different diagramming techniques, and this has given rise to a number of methods that have become recognized in their own right as industry standards. ConceptDraw PRO, with the Workflow Diagrams solution, is ideal for creating diagrams of this type. Its RapidDraw technology takes the strain from diagram arrangement, allowing users to create their process steps with a single click, ideal for generating the many repeatable tasks that can make up a workflow. The Workflow Diagrams solution complements this feature with a library of selected icons to represent various steps.HelpDesk
How to Create a Fault Tree Analysis Diagram (FTD) in ConceptDraw PRO
Fault Tree Diagram are logic diagram that shows the state of an entire system in a relationship of the conditions of its elements. Fault Tree Diagram are used to analyze the probability of functional system failures and safety accidents. ConceptDraw PRO allows you to create professional Fault Tree Diagrams using the basic FTD symbols. An FTD visualize a model of the processes within a system that can lead to the unlikely event. A fault tree diagrams are created using standard logic symbols . The basic elements in a fault tree diagram are gates and events.HelpDesk
How to Create a Typography Infographic Using ConceptDraw PRO
Infographics are a good way to visually share knowledge , to communicate information and illustrate a message. Typography Infographics can help to present at a glance a large pack of complex information in a clear and vivid manner. Designers use the elements of typography Infographics to compose a graphic presentation of an information that is intended to depict the information behind the numbers in a creative and interesting visual way. Each infographic element is used to depict and explain an idea of the current portion of information. Each infographic element must inform its message clearly. ConceptDraw PRO provides the ability to design different kinds of typography infographics. You can use ConceptDraw Typography Infographics solution to create typography infographics effortlessly and quickly using the special set of vector stencils libraries.HelpDesk
How to Design a Mockup of Apple OS X UI
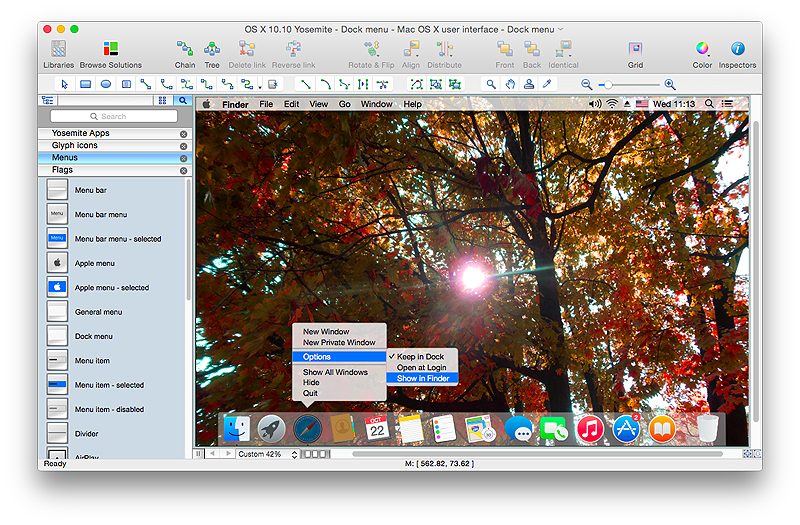
Since that first Macintosh, Apple have always developed and used their own hardware specific operating system. The fundamental style and layout of the Mac OS X user interface has remained largely in place since the earliest versions, but there have been obvious aesthetic enhancements, and elements of icon redesign to match branding across devices. To design an effective user interface, graphic designers will create visual GUI prototypes, that focus on maximizing the user experience. Uses Interface prototyping is much convenient when you can work through a diagram similar to the OS X design. ConceptDraw PRO allows you to develop Apple OS X User Interface (UI) prototypes using the special templates and vector libraries of the specific user interface elements. ConceptDraw Mac OS X UI solution offers libraries containing the distinct Mac app icons, menu bar graphics, glyph elements and other Mac OS X features — everything necessary to create high standard, professional UI graphic desig- Sales workflow - Vector stencils library | Sales flowchart - Vector ...
- Performance Indicators | Design elements - Comparison charts and ...
- Software Dashboard Icons
- HR arrows - Vector stencils library | App icons - Vector stencils ...
- Management indicators - Vector stencils library | Sales performance ...
- Basic Flowchart Symbols and Meaning | HR arrows - Vector stencils ...
- Fishbone Diagram | Sales KPI Dashboards | ConceptDraw Solution ...
- Design elements - Comparison charts and indicators | Design ...
- Intelligence analyst cycle - Arrow loop diagram | The Circular Flow ...
- Business Graphics Software | Customer Relationship Management ...
- Comtech - Vector stencils library | Arrows - Vector clipart library ...
- Circular diagrams - Vector stencils library | Collaboration life-cycle ...
- Basic Flowchart Symbols and Meaning | Purple Bullet Icon Picture
- Target Diagram | Daily Schedule Chart | Target and Circular ...
- Target and Circular Diagrams | Circular Arrows Diagrams | IDEF0 ...
- Curved arrow , top
- How to Connect Tabular Data (CSV) to a Graphic Indicator on Your ...
- Comparison indicators - Vector stencils library | Design elements ...
- Sales Dashboard - Access Anywhere | Dashboard Software ...
- Cisco Network Diagrams | Computer Network Diagrams | Circular ...


