Best Value Stream Mapping mac Software
Create value stream maps - for value stream analysis and value stream management, material and information flow mapping, using our quick start templates included with ConceptDraw.Astronomy Symbols
Are you an astronomer, astronomy teacher or student? And you need to draw astronomy pictures quick and easy? ConceptDraw DIAGRAM diagramming and vector drawing software extended with Astronomy solution from the Science and Education area will help you! Astronomy solution provides 7 libraries with wide variety of predesigned vector objects of astronomy symbols, celestial bodies, solar system symbols, constellations, etc.Mac OS GUI Software
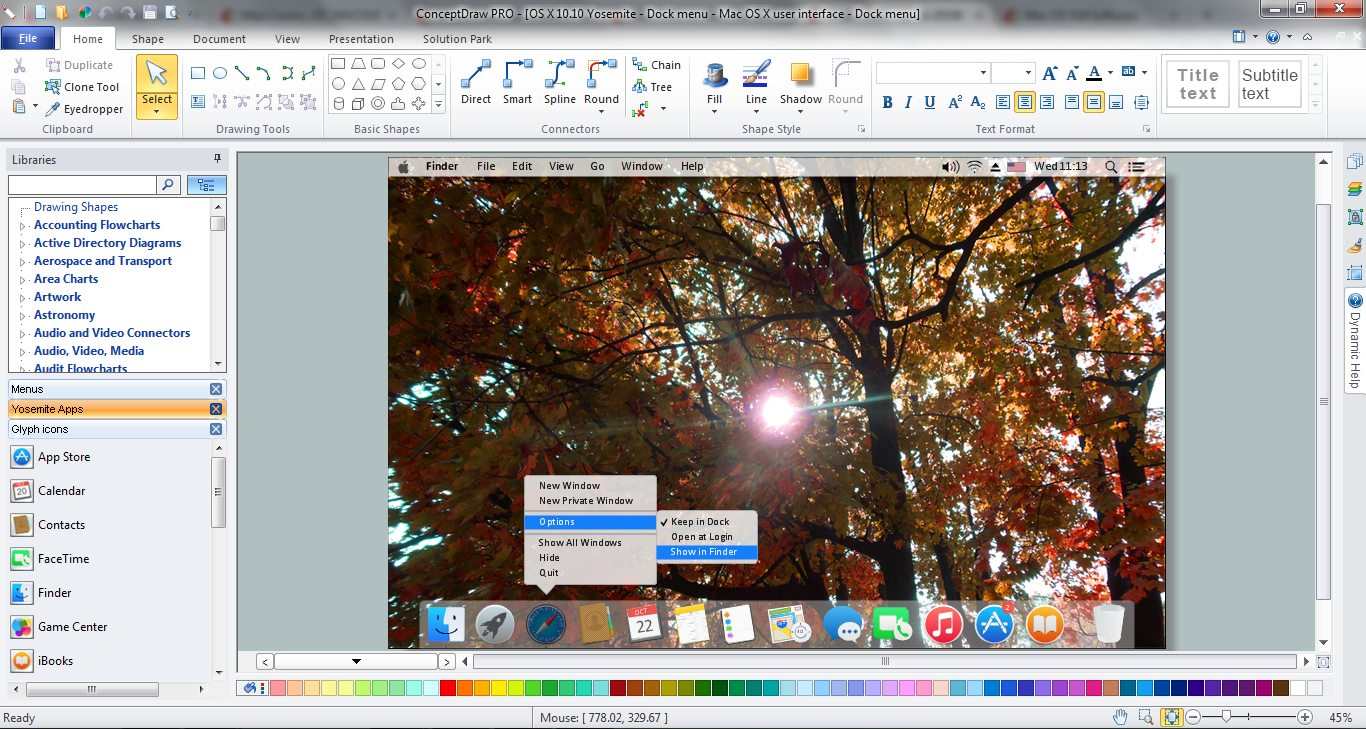
ConceptDraw DIAGRAM diagramming and vector drawing software extended with Mac OS User Interface Solution from the Software Development area is a powerful Mac OS GUI SoftwareRestaurant Floor Plan Software
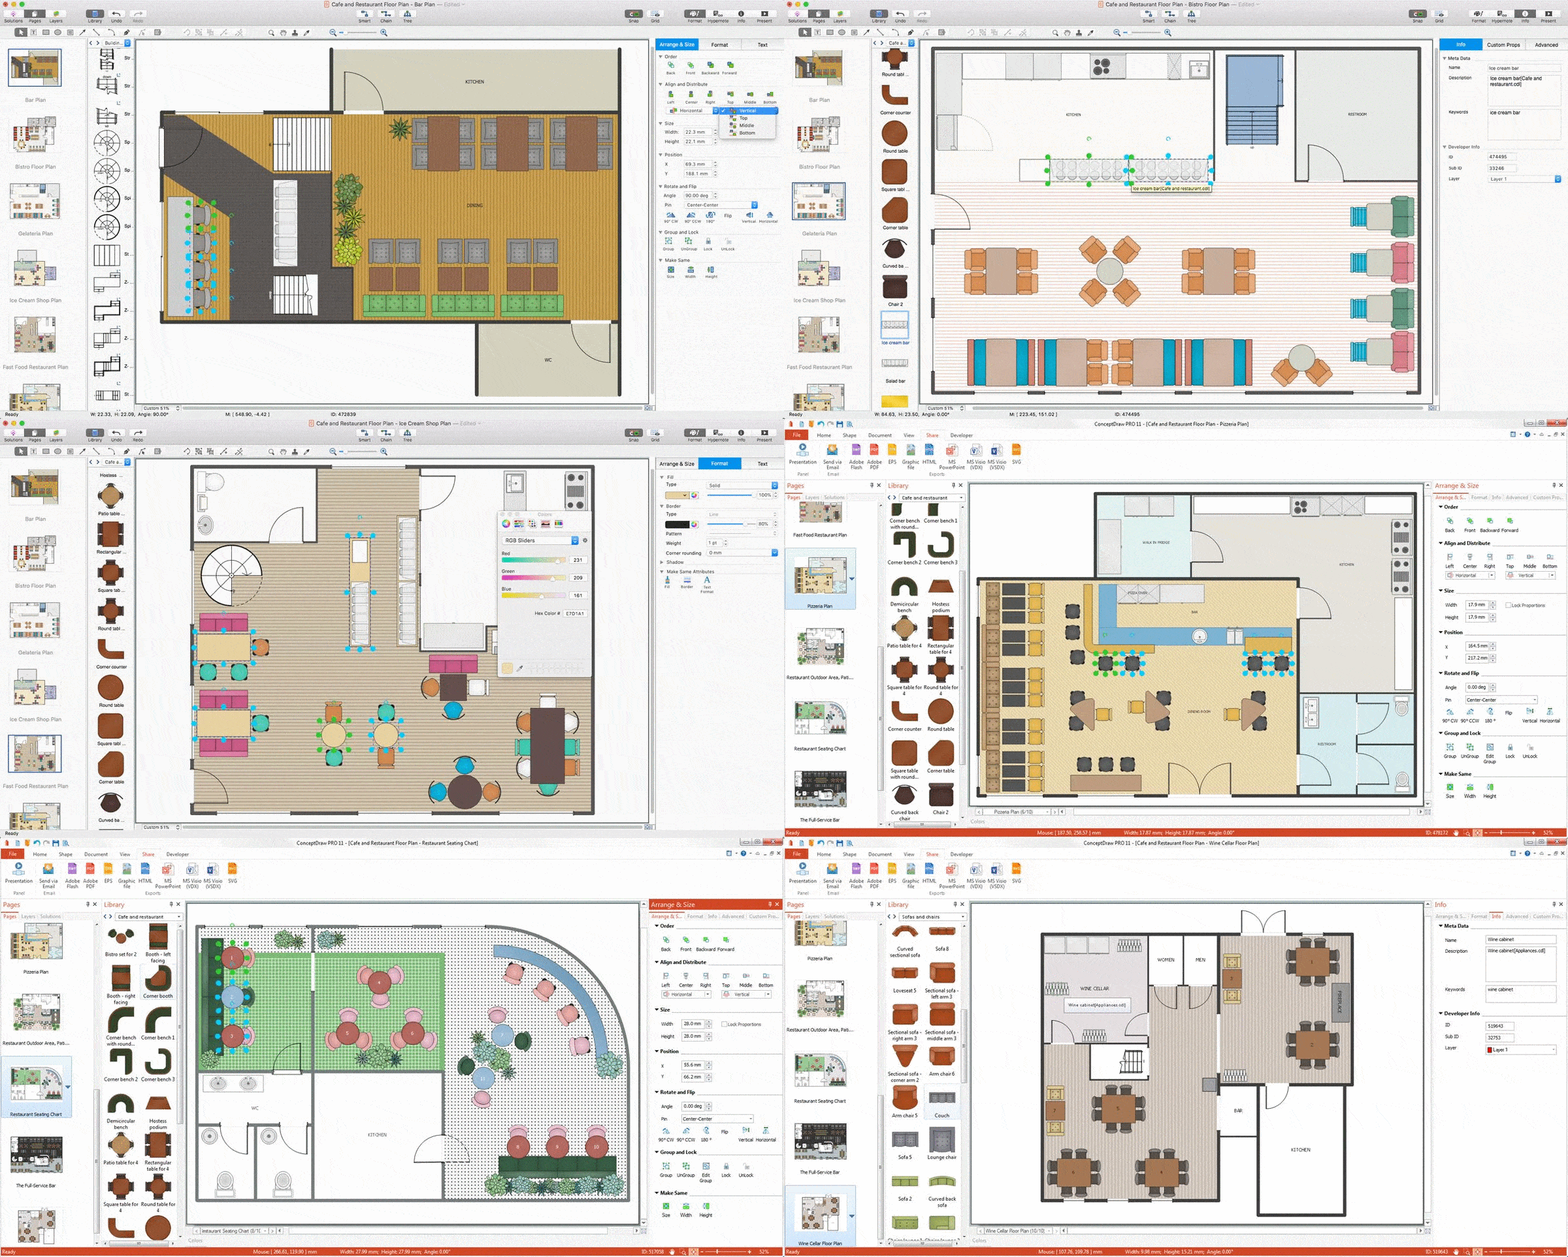
The restaurant is a beautiful place for relax and recreation. But not all the restaurants are popular. What is the secret of popularity and active visiting of some restaurant? People pay special attention for design and atmosphere, they must be pleasant and unique. All design elements, correct planning and furniture layout, location of the main hall and kitchen, beautiful music and good service, delicious dishes, create an unforgettable atmosphere of comfort, harmony, and convenience. Having a powerful ConceptDraw DIAGRAM software extended with Cafe and Restaurant Plans solution from Building Plans Area of ConceptDraw Solution Park, you can create your unique and successful Restaurant Floor plans, Restaurant layouts, and Restaurant designs in a few minutes. This solution includes a lot of Restaurant floor plan samples, examples, templates, and variety of libraries with professionally designed vector objects of different furniture, appliances, and other restaurant design elements helpful for fast and easy drawing Floor plan of restaurant.Best Diagramming Software for macOS
ConceptDraw DIAGRAM creates drawings, flowcharts, block diagrams, bar charts, histograms, pie charts, divided bar diagrams, line graphs, area charts, scatter plots, circular arrows diagrams, Venn diagrams, bubble diagrams with great visual appeal on Mac OS X.
TQM Diagram Tool
The Total Quality Management Diagram solution helps you and your organization visualize business and industrial processes. Create Total Quality Management diagrams for business process with ConceptDraw software.Software for flowchart diagrams
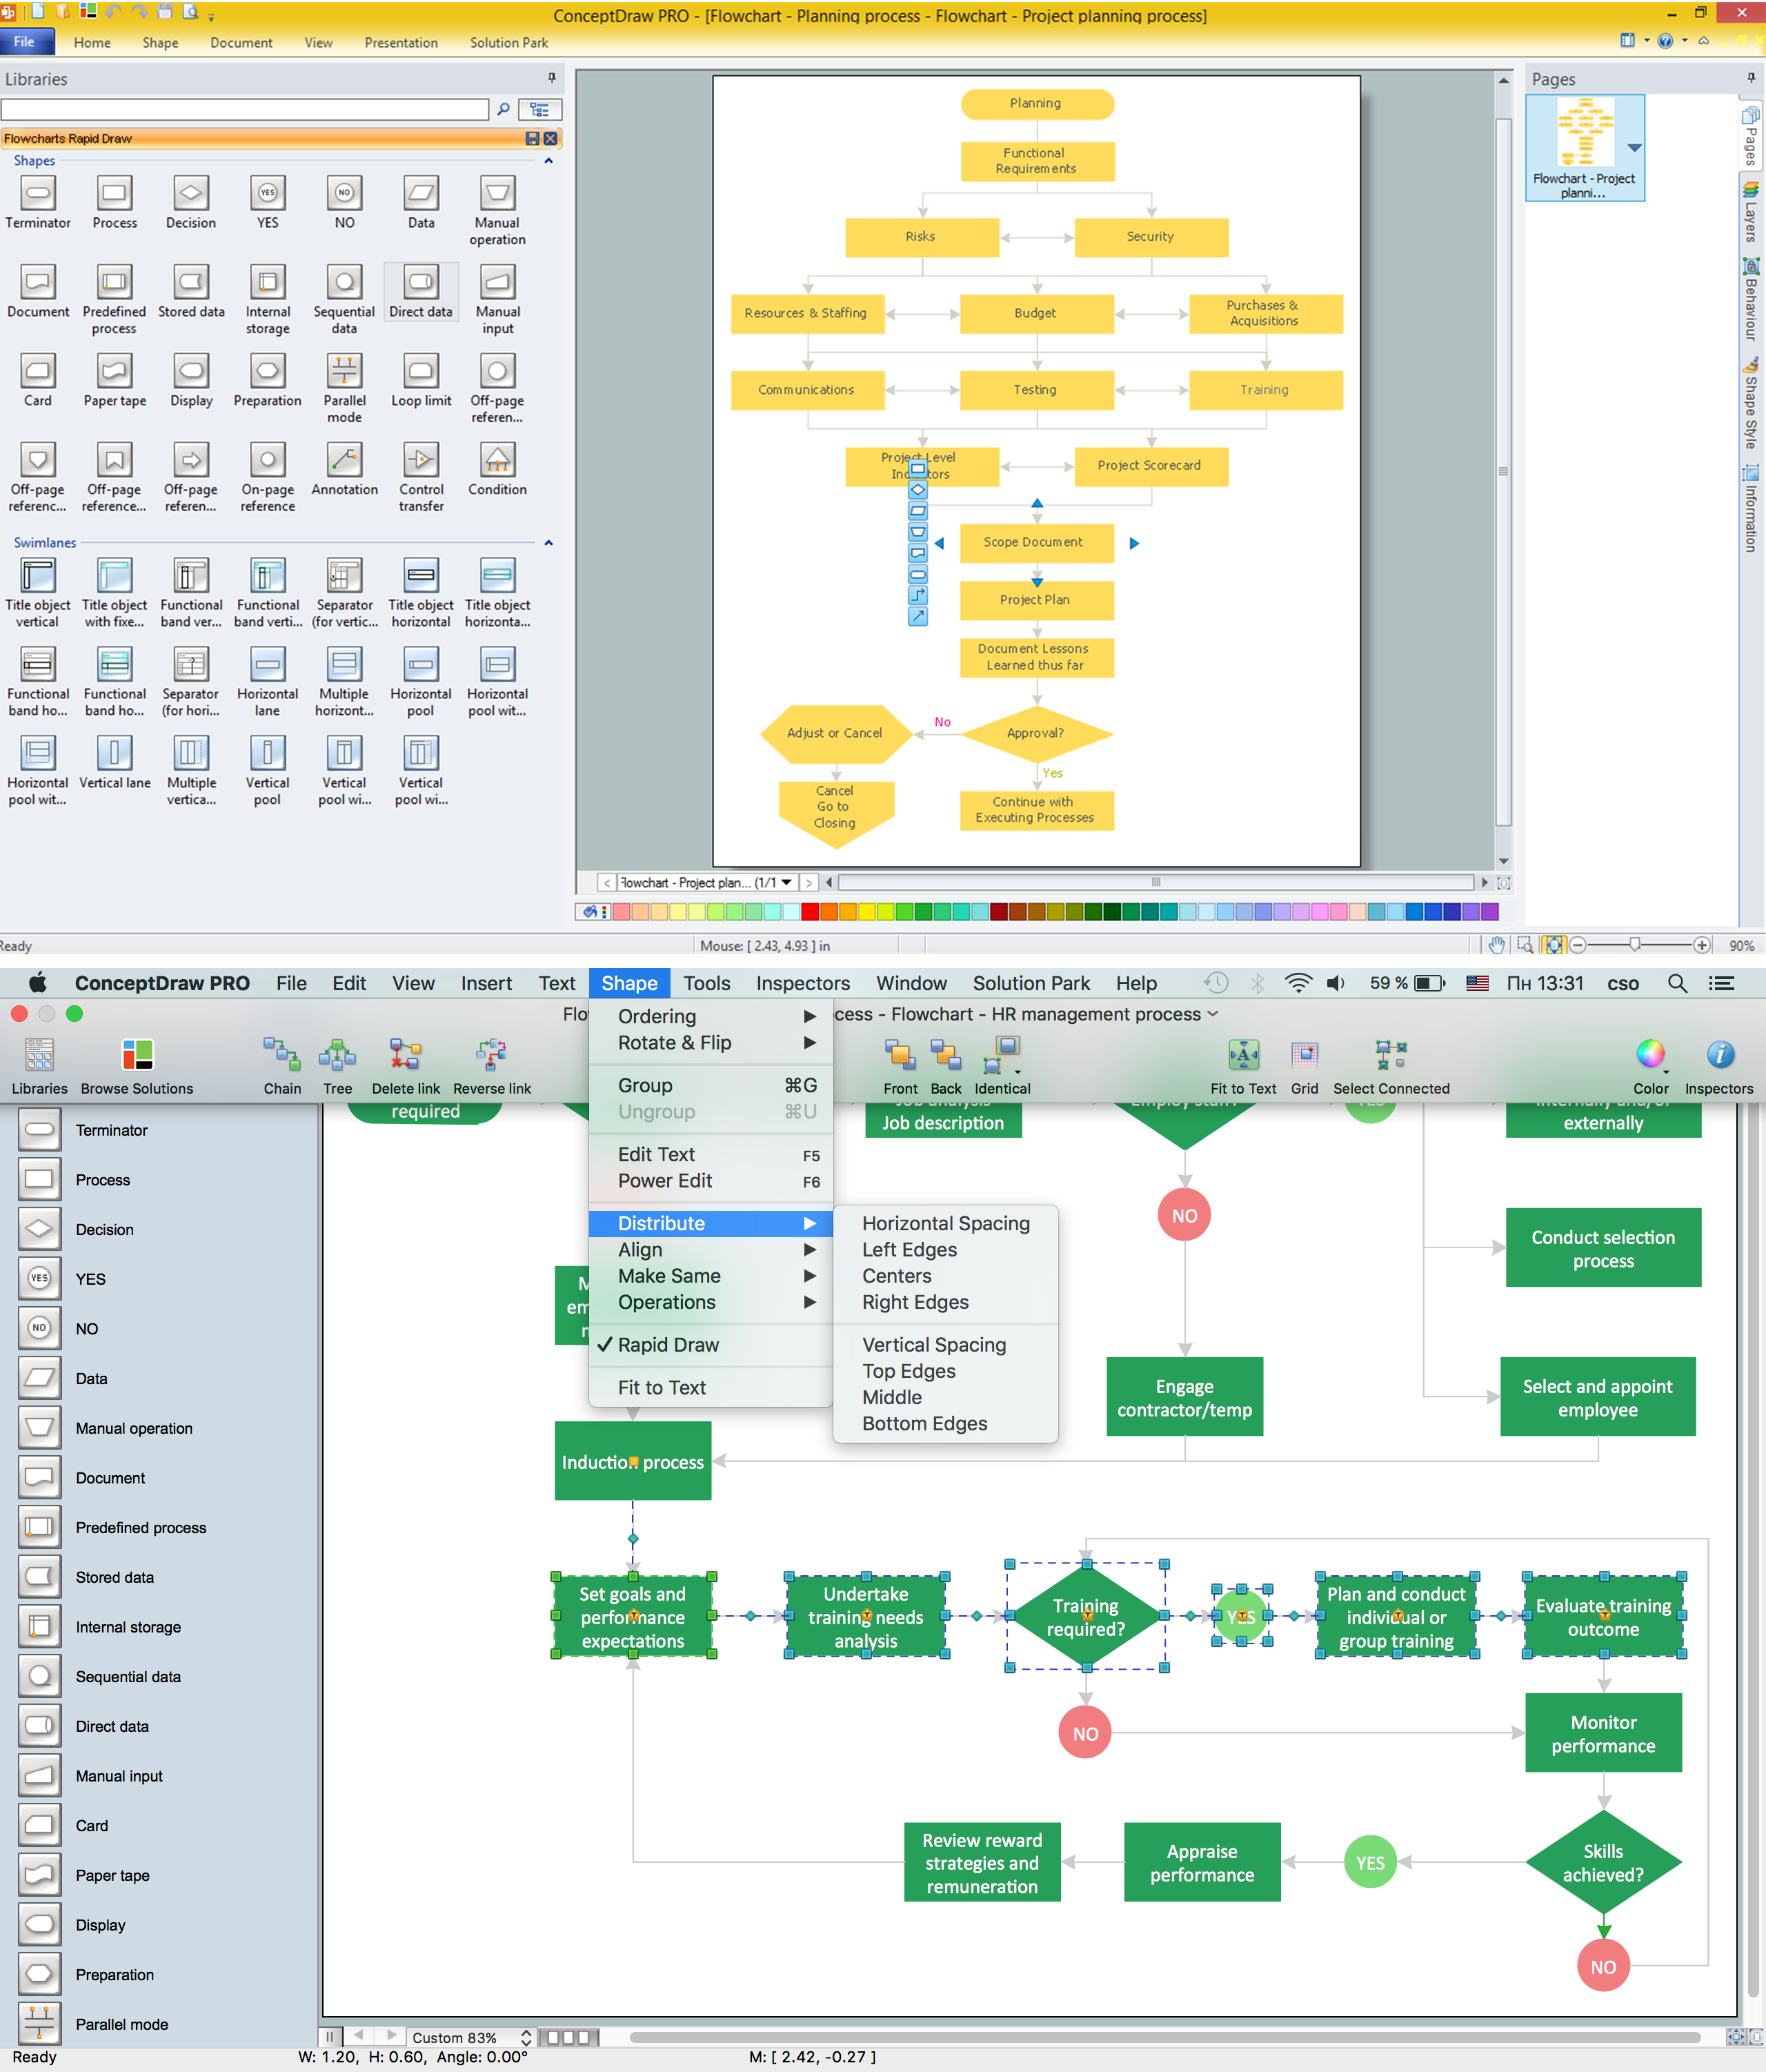
Software for flowchart diagrams can help you: represents an algorithm or process, illustrates a solution to a given problem, represented process operations, analyzing a business process, designing a business process, documenting a business process, optimizing a business process. The Flowcharts Solution from the "Diagrams" area of ConceptDraw Solution Park contains a wide set of predesigned templates, samples and 3 libraries.Technical Drawing Software
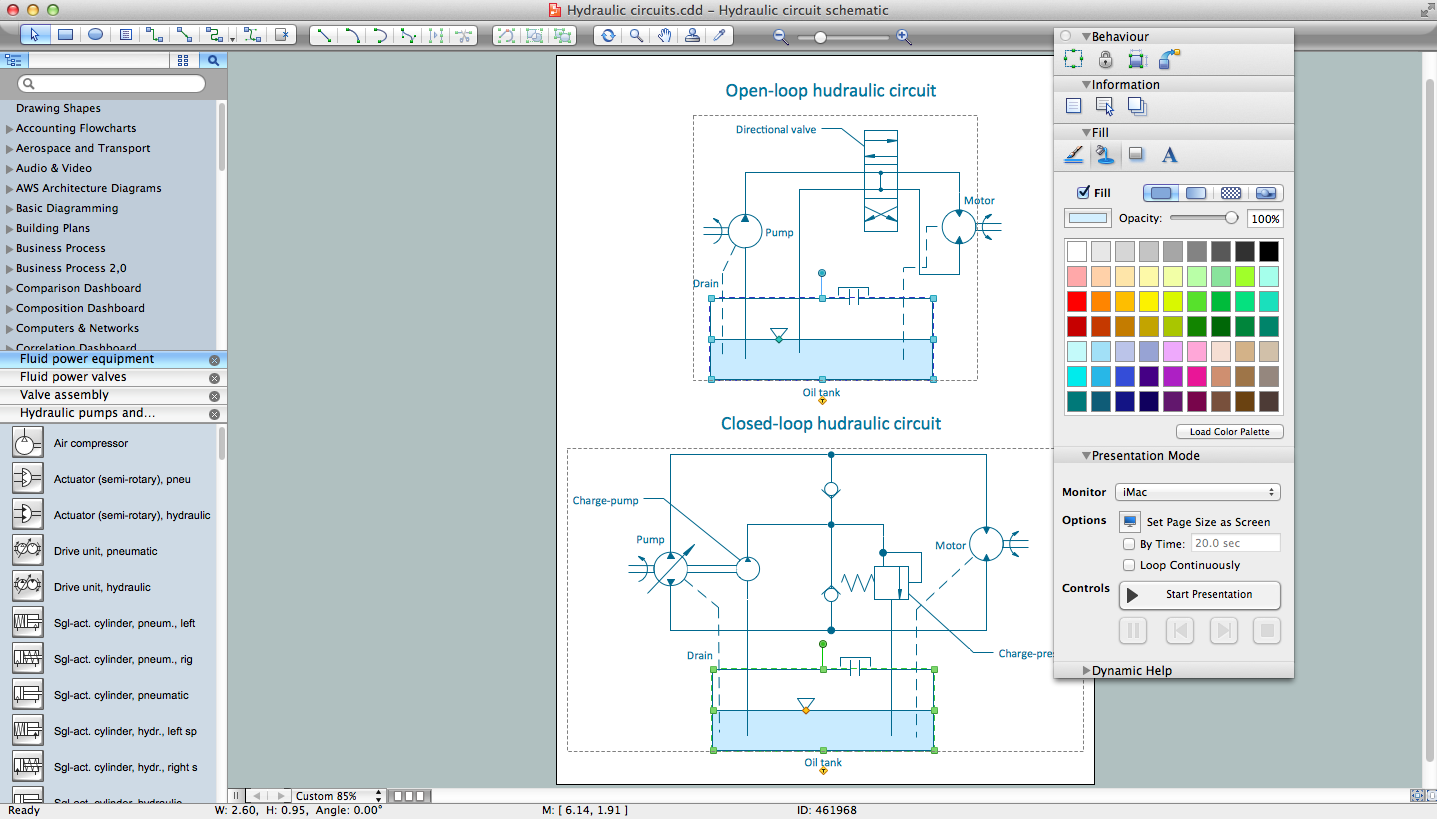
In conditions of rapidly developing and progressing modern technologies in various fields of science and technics, a powerful specialized software is very popular and highly demanded today. In this area particularly valuable is a technical drawing software. ConceptDraw DIAGRAM is a unique professional vector diagramming software for business and technical drawing. Enhanced with powerful drawing tools of Mechanical Engineering solution from the Engineering area of ConceptDraw Solution Park, it is ideal for designing Technical Drawings, Electrical Schematics, Mechanical Systems Drawings, Plumbing Drawings, Structural Drawings, Architectural Drawings, Circuit Diagrams, and many other types of technical diagrams and schematics of any degree of complexity and any level of detailing. Included numerous predesigned mechanical engineering and technical drawing objects and symbols make a technical drawing process as simple as possible. Besides, ConceptDraw DIAGRAM offers extensive export capabilities that promote the active exchange of ideas and results with colleagues and other stakeholders.
 macOS User Interface
macOS User Interface solution extends the ConceptDraw DIAGRAM functionality with powerful GUI software graphic design features and tools. It provides an extensive range of multifarious macOS Sierra user interface design examples, samples and templates, and wide variety of libraries, containing a lot of pre-designed vector objects of Mac Apps icons, buttons, dialogs, menu bars, indicators, pointers, controls, toolbars, menus, and other elements for fast and simple designing high standard user interfaces of any complexity for new macOS Sierra.
How to Draw EPC Diagram Quickly
An event-driven process chain diagram is a flowchart used in business process analysis. It evolved from Architecture of Integrated Information Systems (ARIS) and utilised in the business process improvement and analysis. It is also used to facilitate enterprise resource planning. An EPC diagram is a complex flowchart that shows different business processes through various workflows. The workflows are seen as functions and events that are connected by different teams or people, as well as tasks that allow business processes to be executed. ConceptDraw DIAGRAM is a software for making EPC diagrams that allows managers visually present business process models for making decisions for business.
- Mechanical Drawing Software | Best Vector Drawing Application for ...
- Illustration Software | Biology Drawing Software | Astronomy ...
- Sketching Software | Astronomy and Astrology | Astronomy Symbols ...
- Sun Solar System | Astronomy and Astrology | Astronomy Symbols ...
- Sketching Software | Astronomy and Astrology | Illustration Software ...
- Process Flow Chart | Drawing Illustration | Best Vector Drawing ...
- How to Draw a Сonstellation Сhart | Astronomy | Zodiac Star ...
- Education | UML Diagram Types List | UML Diagram for Mac ...
- ER diagram tool for OS X | Best Vector Drawing Application for Mac ...
- Biology Drawing Software | Chemistry Drawing Software | Biology ...


