ATM Solutions
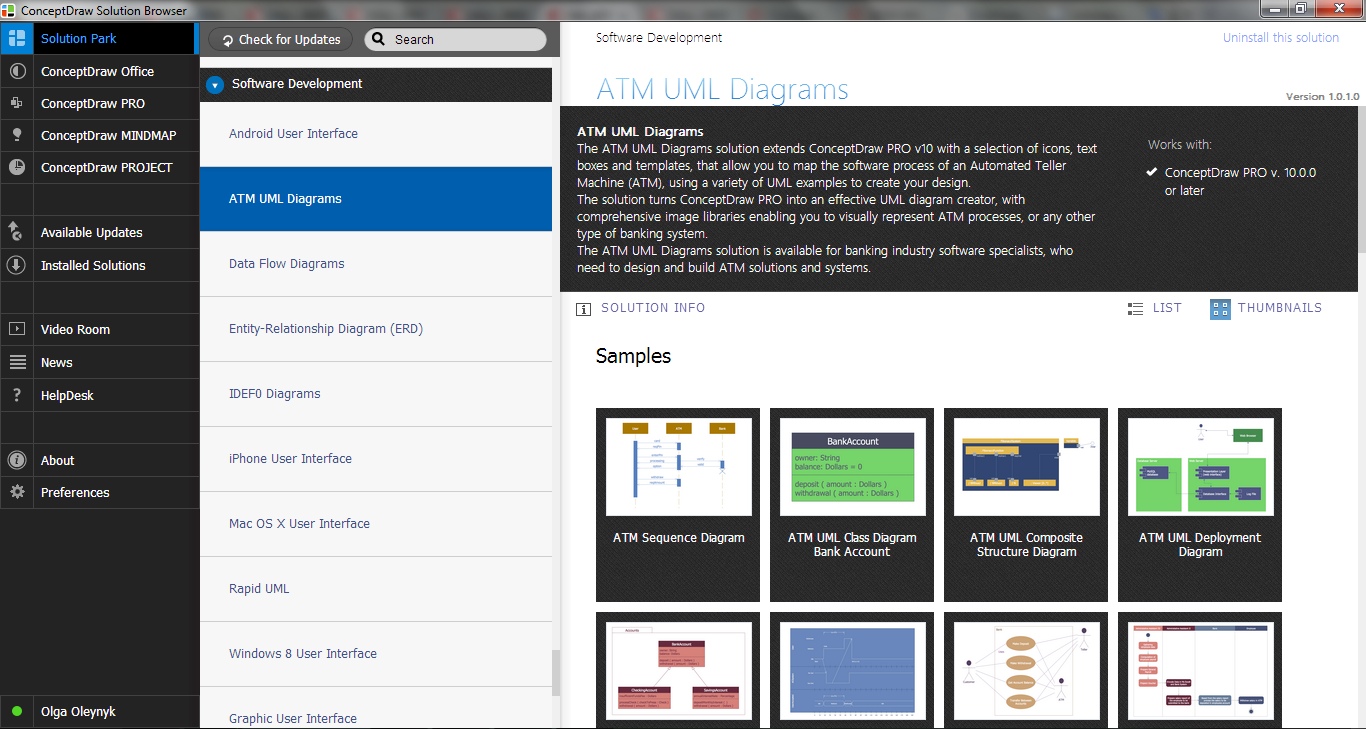
In the modern world the ATM Solutions are necessity for various software specialists, designers and developers in banking industry. ConceptDraw PRO diagramming and vector drawing software offers the unique ATM UML Diagrams Solution from the Software Development Area of ConceptDraw Solution Park.Account Flowchart Stockbridge System. Flowchart Examples
Create your own flow charts of data processing systems using the ConceptDraw PRO diagramming and vector drawing software extended with the Cross-Functional Flowcharts solution from the Business Processes area of ConceptDraw Solution Park. This is a flowchart of a data processing system combining manual and computerized processing to handle accounts receivable, billing, and general ledger.UML Use Case Diagram Example. Services UML Diagram. ATM system
Services UML Diagram. ATM system. This sample was created in ConceptDraw PRO diagramming and vector drawing software using the UML Use Case Diagram library of the Rapid UML Solution from the Software Development area of ConceptDraw Solution Park. This sample shows the scheme of the servicing using the ATMs (Automated Teller Machines) and is used at the working of ATM banking systems, at the performing of the banking transactions.
 Cross-Functional Flowcharts
Cross-functional flowcharts are powerful and useful tool for visualizing and analyzing complex business processes which requires involvement of multiple people, teams or even departments. They let clearly represent a sequence of the process steps, the order of operations, relationships between processes and responsible functional units (such as departments or positions).
HelpDesk
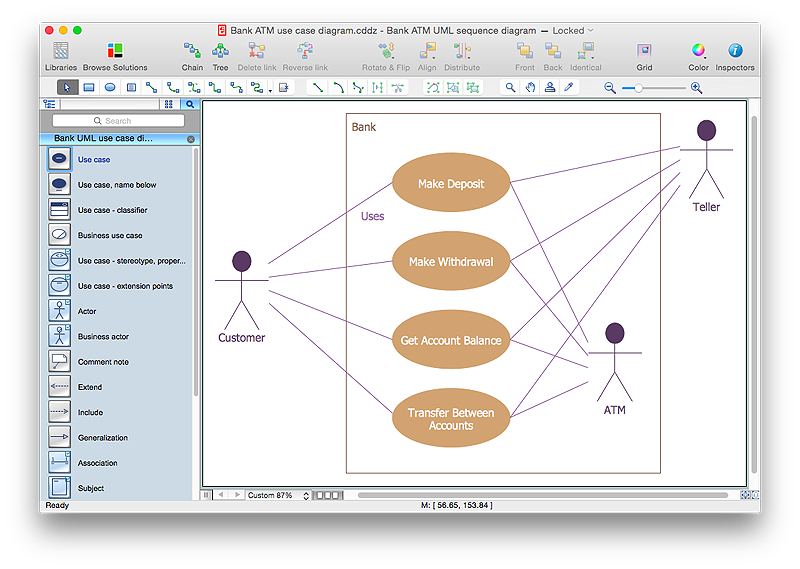
How to Create a Bank ATM Use Case Diagram Using ConceptDraw PRO
UML diagrams are often used in banking management for documenting a banking system. In particular, the interaction of bank customers with an automated teller machine (ATM) can be represented in a Use Case diagram. Before the software code for an ATM, or any other system design, is written, it is necessary to create a visual representation of any object-oriented processes. This is done most effectively by creating a Unified Modeling Language (UML) diagram, using object-oriented modeling. UML works as a general purpose modeling language for software engineers or system analysts, offering a number of different diagram styles with which to visually depict all aspects of a software system.ConceptDraw PRO diagramming software, enhanced and expanded with the ATM UML Diagrams solution, offers the full range of icons, templates and design elements needed to faithfully represent ATM and banking information system architecture using UML standards. The ATM UML Diagrams solution is useful for beginner and advanced users alike. More experienced users will appreciate a full range of vector stencil libraries and ConceptDraw PRO's powerful software, that allows you to create your ATM UML diagram in a matter of moments.
Work Flow Chart
What is a Work Flow Chart? It is a chart which visually displays the step-by-step transferring of data, documents and tasks during the work. ConceptDraw PRO extended with Workflow Diagrams solution from the Business Processes area of ConceptDraw Solution Park is the best software for drawing the Work Flow Chart of any complexity.Cross-Functional Flowcharts in ConceptDraw
Use ConceptDraw PRO enhanced with solutions from ConceptDraw Solution Park to create diagrams to present and explain structures, process flows, logical relationships and networks.Accounting Flowchart Purchasing Receiving Payable and Payment
Accounting flowchart is a pictorial way to represent the flow of data in an organization and the flow of transactions process in a specific area of its accounting or financial department. Accounting Flowcharts solution contains the full set of standardized accounting flowchart symbols which will help you design in minutes various types of Accounting Flowcharts including such popular diagrams which represent the whole accounting process: Purchasing Flowchart, Receiving Flowchart, Voucher Payable Flowchart, Treasurer Flowchart, Payment Flowchart.UML Component Diagram
UML Component Diagrams are used to illustrate the structure of arbitrarily complex systems and illustrates the service consumer - service provider relationship between components.
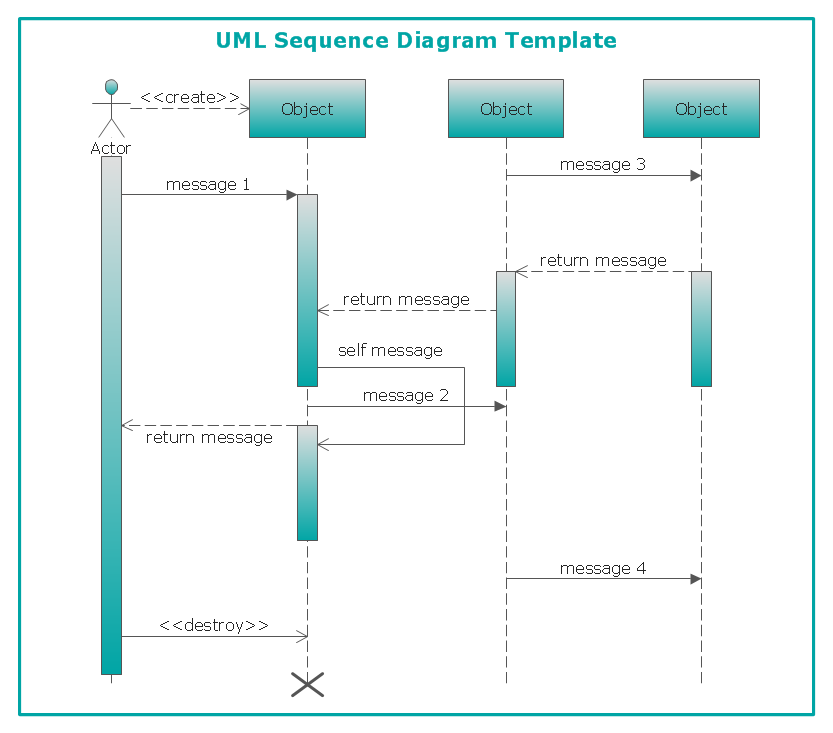
UML Sequence Diagram
UML Sequence Diagram can be created using ConceptDraw PRO diagramming software contains rich examples and template. ConceptDraw is perfect for software designers and software developers who need to draw UML Sequence Diagrams.
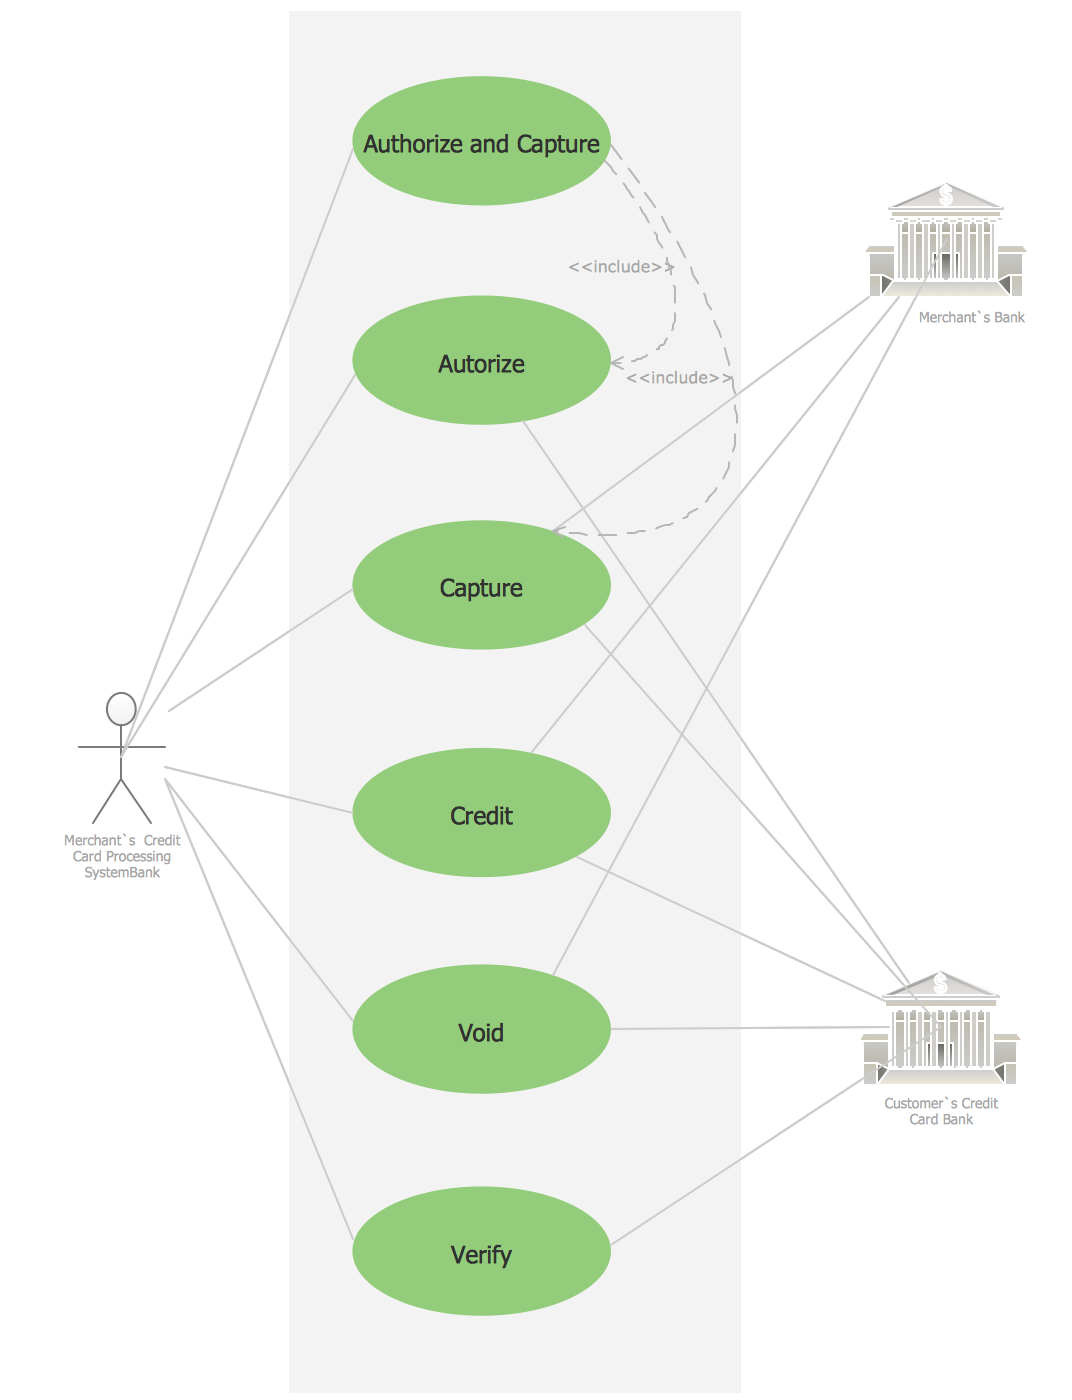
Credit Card Processing System UML Diagram
Credit Card Processing System UML Diagram. This sample shows the Use Case Diagram of the credit card processing system. You can see how the payment by credit card occurs. This sample can be used by the bank, financial enterprises, for understanding the work of the credit card processing system at the projecting the banking systems.
 Audit Flowcharts
Audit flowcharts solution extends ConceptDraw PRO software with templates, samples and library of vector stencils for drawing the audit and fiscal flow charts.
 Flowcharts
The Flowcharts Solution for ConceptDraw PRO v10 is a comprehensive set of examples and samples in several different color themes for professionals that need to graphically represent a process. Solution value is added by basic flow chart template and shapes' library of Flowchart notation. ConceptDraw PRO flow chart creator lets one depict a processes of any complexity and length, as well design of the flowchart either vertically or horizontally.
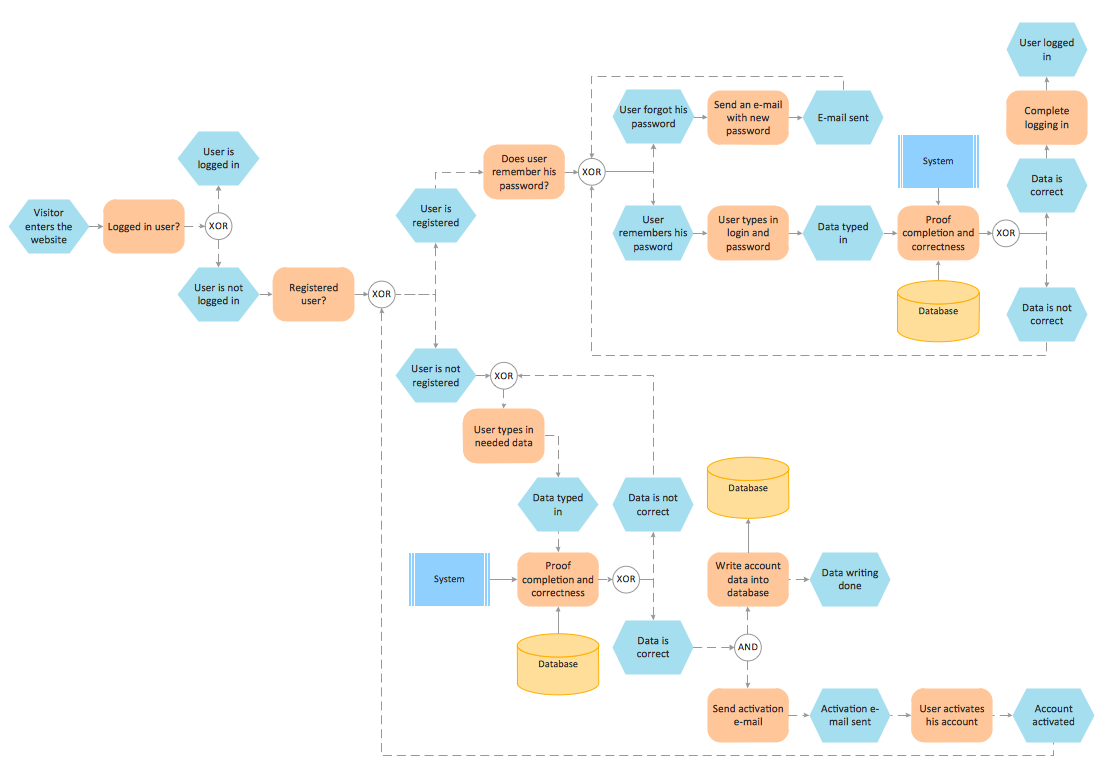
Formalization and Verification of Event-driven Process chain
EPC or The Event - driven Process Chain diagrams that provide Enterprise Resource Planning improvement. ConceptDraw PRO - software that reduces the time needed to create a business process model.- Process Flowchart | Data Flow Diagrams | Basic Flowchart Symbols ...
- Flowchart Of Atm Management System
- Activity Diagram For Atm Banking System With Swimlanes
- Flowchart Banking System
- Draw A System Flow Diagram For Online Banking System
- System Flowchart Banking System
- Data Flow Diagram For Atm Banking System
- Bank System Flow Chart
- Process Flowchart | How to Create a Bank ATM Use Case Diagram ...
- Control Flow Diagram Banking System
- Process Flowchart | Data Flow Diagrams (DFD) | Flowchart on Bank ...
- Example Of Dfd And Erd Banking System
- Process Flowchart | UML Use Case Diagram Example. Services ...
- Draw Structure Chart For Banking Management System
- ATM UML Diagrams | ATM Solutions | Process Flowchart | In ...
- Flowchart on Bank . Flowchart Examples | How to Connect Social ...
- Use Case Sequence Diagram Withdraw For Atm Banking System
- UML Deployment Diagram Example - ATM System UML diagrams ...
- Atm System Flow Chart
- Draw Dfd On Banking System
