 ATM UML Diagrams
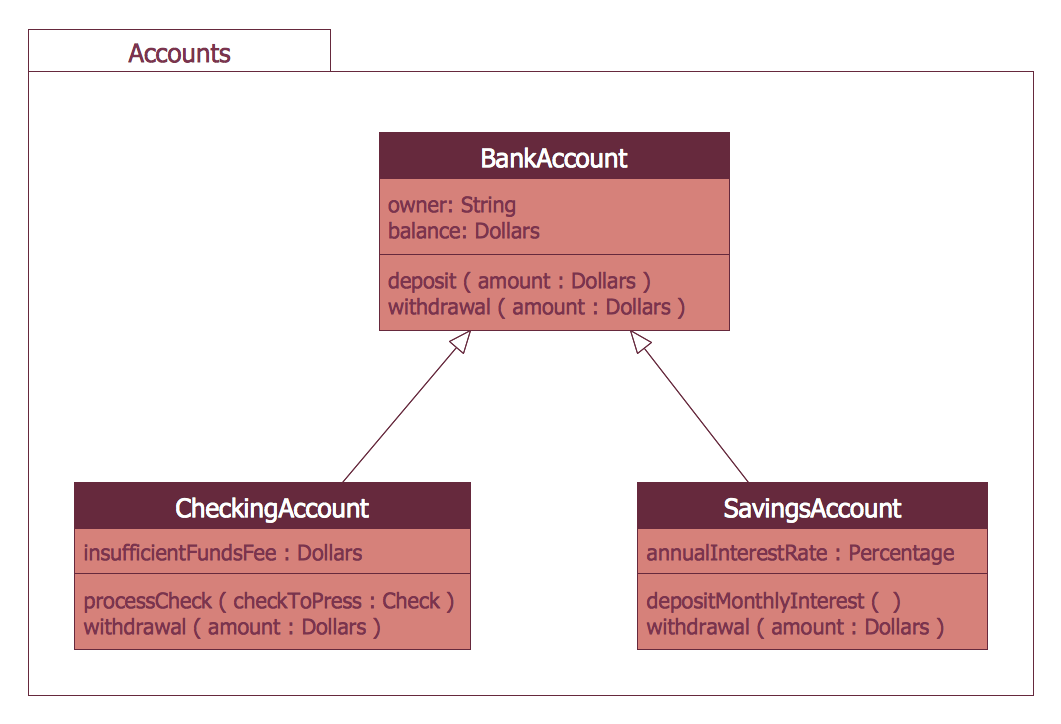
The ATM UML Diagrams solution lets you create ATM solutions and UML examples. Use ConceptDraw DIAGRAM as a UML diagram creator to visualize a banking system.
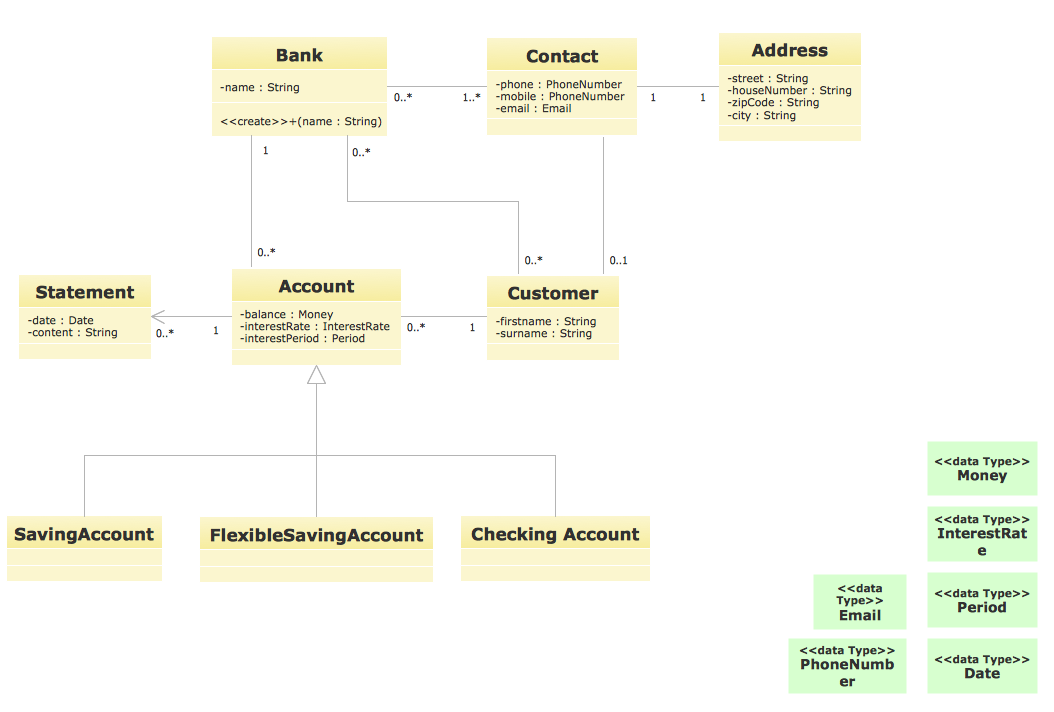
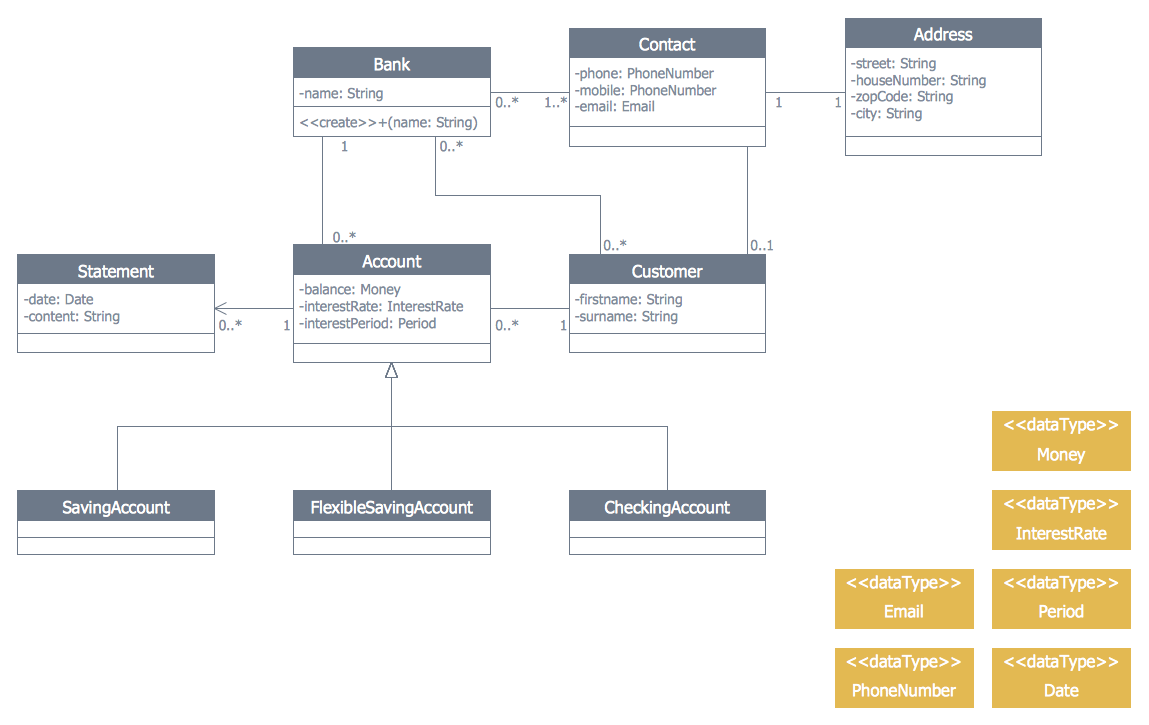
UML for Bank
UML for Bank - This sample was created in ConceptDraw DIAGRAM diagramming and vector drawing software using the UML Class Diagram library of the Rapid UML Solution from the Software Development area of ConceptDraw Solution Park.Bank System
The UML Diagrams are widely used by developers and software engineers for professionally design and development any bank system or Automated Teller Machine (ATM) system. You need a powerful software for their design? ConceptDraw DIAGRAM extended with ATM UML Diagrams Solution from the Software Development Area of ConceptDraw Solution Park suits the best for this goal.Banking System
ConceptDraw DIAGRAM extended with ATM UML Diagrams Solution from the Software Development Area of ConceptDraw Solution Park is a powerful software for representing the ATM processes, for designing and building banking system and ATMs.UML Use Case Diagram Example. Services UML Diagram. ATM system
Services UML Diagram. ATM system. This sample was created in ConceptDraw DIAGRAM diagramming and vector drawing software using the UML Use Case Diagram library of the Rapid UML Solution from the Software Development area of ConceptDraw Solution Park. This sample shows the scheme of the servicing using the ATMs (Automated Teller Machines) and is used at the working of ATM banking systems, at the performing of the banking transactions."A payment is the transfer of an item of value from one party (such as a person or company) to another in exchange for the provision of goods, services or both, or to fulfill a legal obligation. ...
Payment methods.
There are two types of payment methods; exchanging and provisioning. Exchanging is to change coin, money and banknote in terms of the price. Provisioning is to transfer money from one account to another. In this method, a third party must be involved. Credit card, debit card, Cheques, money transfers, and recurring cash or ACH (Automated Clearing House) disbursements are all electronic payments methods. Electronic payments technologies are magnetic stripe card, smartcard, contactless card and mobile handset. Mobile handset based payments are called mobile payments." [Payment. Wikipedia]
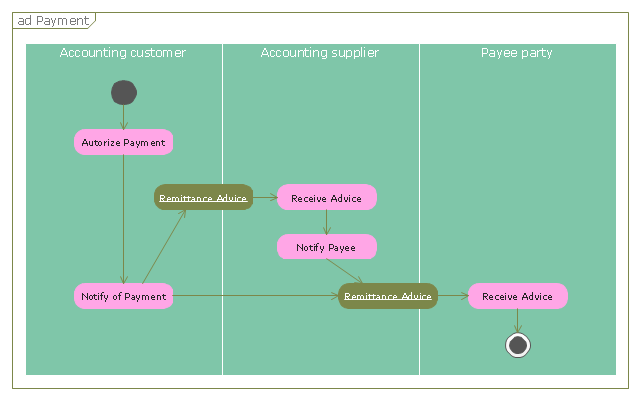
The UML activity diagram example "Payment process" was created using the ConceptDraw PRO diagramming and vector drawing software extended with the Rapid UML solution from the Software Development area of ConceptDraw Solution Park.
Bank Customer Notifications
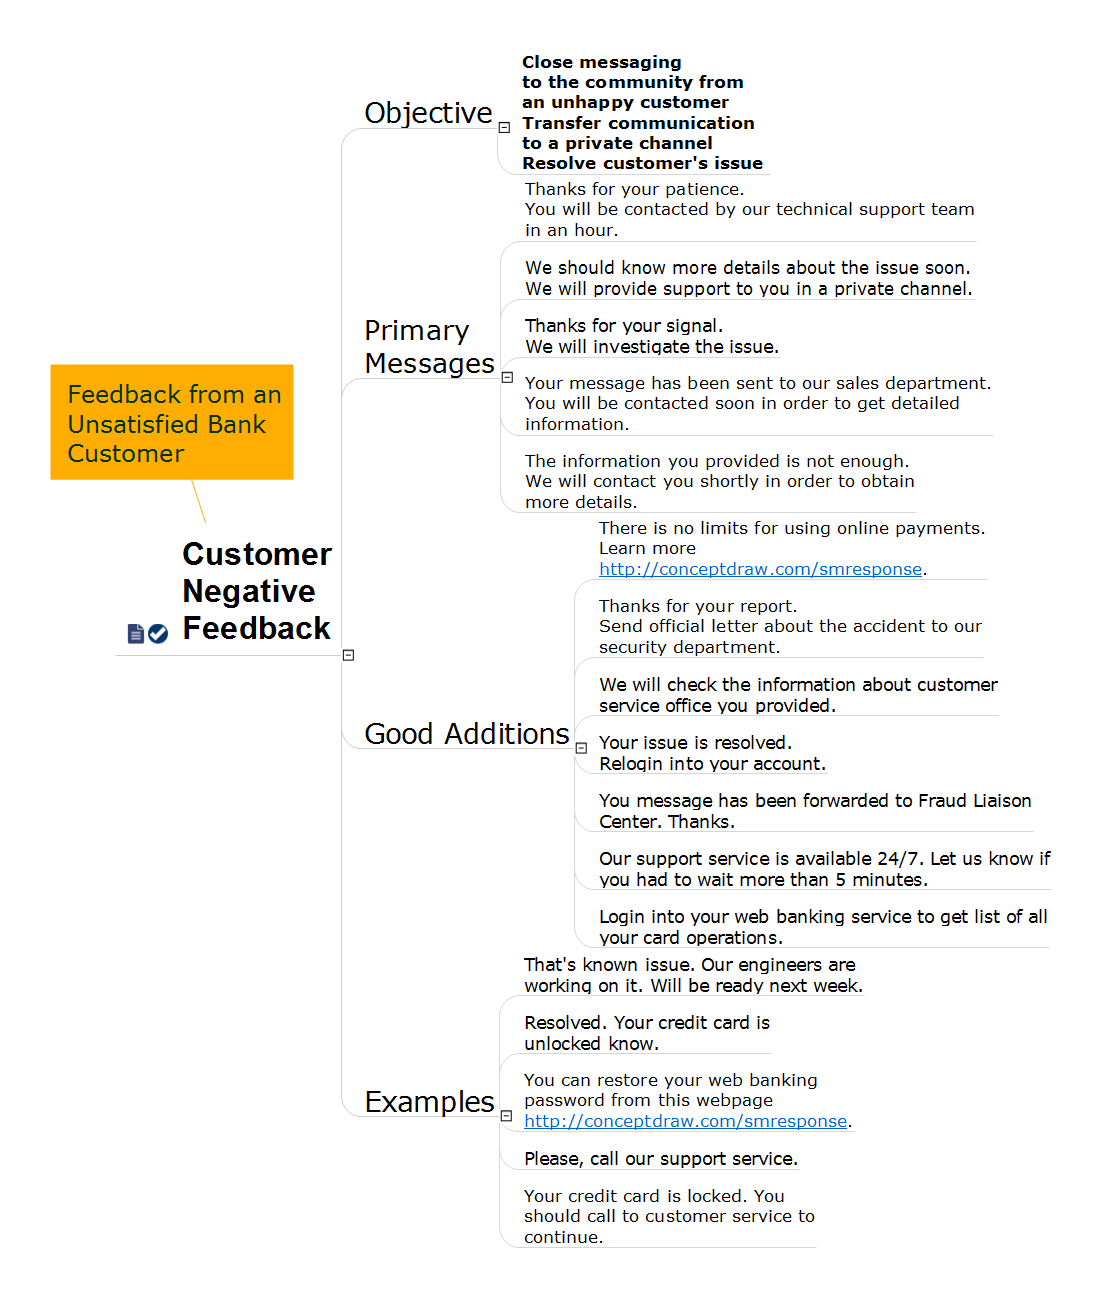
To sell successfully the products or services, it is needed to actively work to continuously trigger a barrage of positively-charged emotions, positive feedbacks and smiles from customers. Positive reviews, references and feedbacks from satisfied customers in many cases are the base for company's success. But at the same time, the negative feedbacks are not less important opinions, which allow you to make your product or service better, qualitatively and successfully. After receiving a negative feedback it is important to react to it correctly, in any case not to ignore it, and to try to reassure the client, to make the improvements, to fix the corresponding errors and immediately inform the unsatisfied client about changes, to turn it into a happy and satisfied, and may be even get a positive respond or a good review from it. This action Mind Map designed in ConceptDraw MINDMAP helps to close the messaging to the community from unhappy or unsatisfied customers, to transfer communication to a private channel and promptly resolve the customers issues.Data Flow Diagram
Data Flow Diagram (DFD) is the part of the Structured Systems Analysis and Design Methodology (SSADM), which is intended for information systems projection and analysis. Data Flow Diagrams allow graphically represent the data flows in information system and analyze the data processing during the structural projection. This type of diagrams lets visually show a work of information system and results of this work, it is often used in connection with human processes and can be displayed as Workflow diagram. Data Flow Diagram visualizes processes and functions, external entities, data depositories, and data flows connecting these elements and indicating direction and data character. Each of these elements used for DFD has its own graphical notation. There are two notations to draw DFDs - Yourdon & Coad and Gane & Sarson. ConceptDraw DIAGRAM extended with Data Flow Diagrams (DFD) solution from Software Developmant area is ideal for designing professional looking DFDs, which can be then easily exported in various formats.Multiprotocol Label Switching (MPLS). Computer and Network Examples
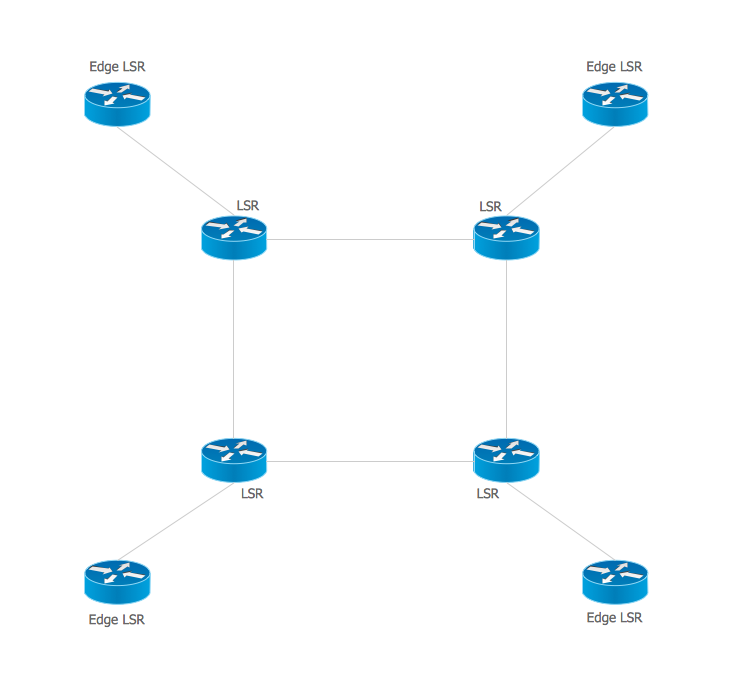
Multiprotocol Label Switching (MPLS) is a mechanism in high-performance telecommunication networks that implements the data transfer from one network node to another using the labels. ConceptDraw DIAGRAM is a powerful network diagramming and vector drawing software that provides the Computer and Networks solution with wide set of ready-to-use predesigned vector stencils and examples to help you design the MPLS Networks quick and easy.
That Helps Professional Social Media Teams
Using a combination of Interactive Flowcharts with Action Mind Maps helps professional social media teams be more proactive and prepared with proper responses. Social Media Response solution minimizes Time-to-Response, improves the quality of responses, and assists in your entire marketing strategy.Biology Drawing
It is impossible to imagine the biology science without drawings. Drawings are very convenient way to explain the different biological knowledge and processes. If you dream to design any biology drawing quick and easy – the ConceptDraw DIAGRAM software is exactly what you need. ConceptDraw DIAGRAM diagramming and vector drawing software extended with Biology solution from the Science and Education area offers the useful tools for easy biology drawing.Bank Detailed Answers
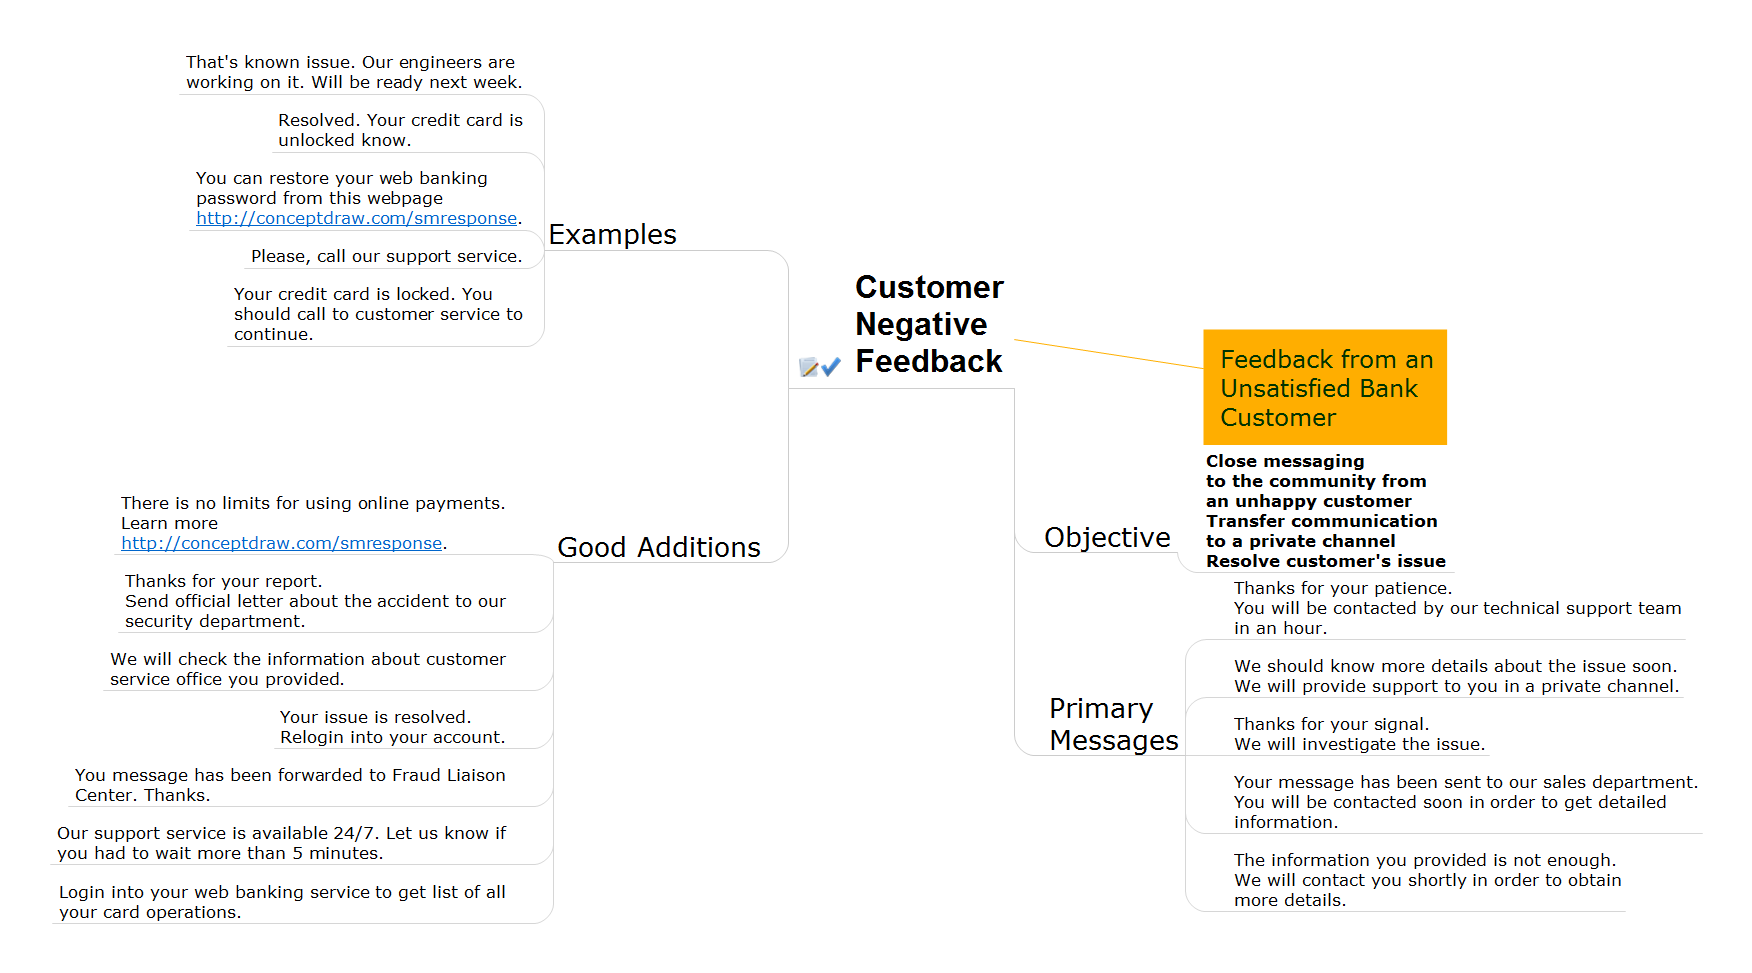
ConceptDraw MINDMAP software and Social Media Response solution from ConceptDraw Solution Park provide an innovative combination of action Mind Maps and interactive Flow Charts, they deliver the interactive tools that help easily accumulate and structure knowledge and experience, to boost your social media success, and quickly find the appropriate responses to social media mentions. Social Media Response solution is helpful for using by PR professionals, social media specialists, consultants and strategists, internet entrepreneurs, sales people, trainers and coaches, bloggers, technical support, online marketing agencies, and many others. The success of any business, which is related in any degree with customers and depends from their opinion, requires the special attention to the communication with customers. This Mind Map organizes and visually represents the useful and detailed information about bank services, about the questions frequently asked by customers in a bank sphere, and helps quickly and competently answer them.
 Cross-Functional Flowcharts
Cross-functional flowcharts are powerful and useful tool for visualizing and analyzing complex business processes which requires involvement of multiple people, teams or even departments. They let clearly represent a sequence of the process steps, the order of operations, relationships between processes and responsible functional units (such as departments or positions).
DFD Flowchart Symbols
A Data Flow Diagram (DFD) is a graphical technique which allows effectively model and analyze the information processes and systems. The ability to fast and easy create the DFDs is made possible with Data Flow Diagrams solution from the Software Development area of ConceptDraw Solution Park. For designing the Data Flow Diagrams are used simple DFD flowchart symbols which are connected each other by arrows depicting the data flow from one step to another.Network wiring cable. Computer and Network Examples
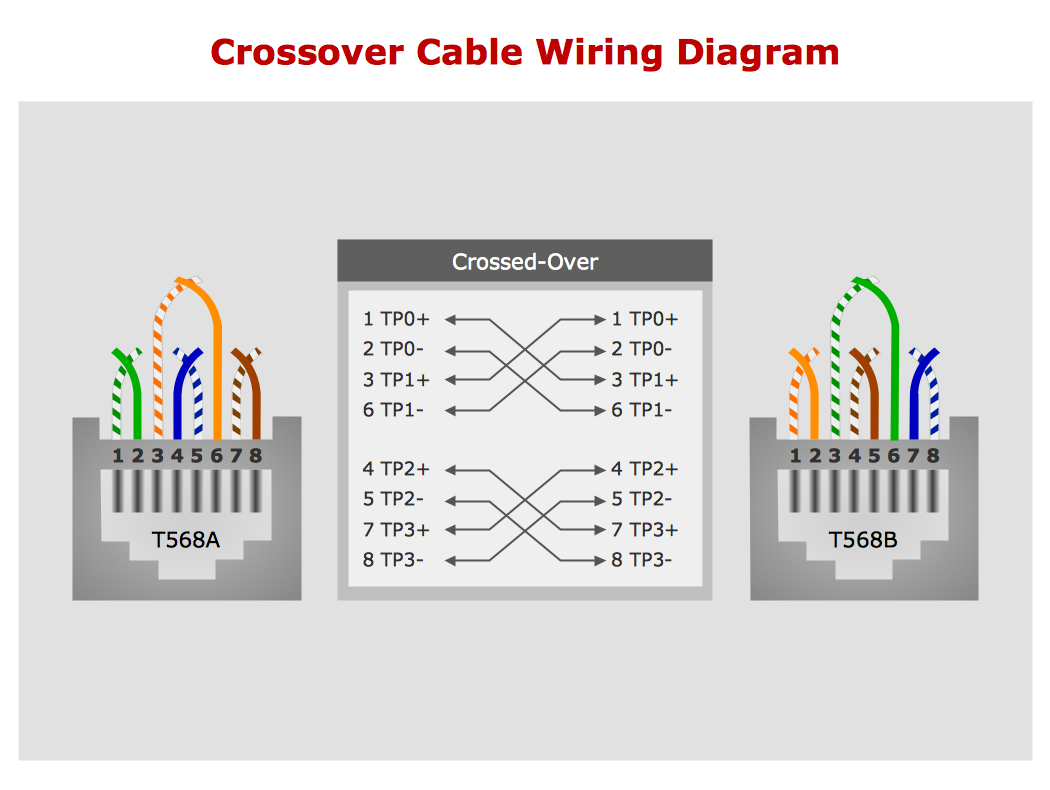
To connect two or more network devices are used the network cables. There are more different types of the network cables: Coaxial cable, Optical fiber cable, Twisted Pair, Ethernet crossover cable, Power lines and others. They are used depending of the network topology, size, protocol. This example was created in ConceptDraw DIAGRAM using the Computer and Networks solution from the Computer and Networks area of ConceptDraw Solution Park.
 Data Flow Diagrams (DFD)
Data Flow Diagrams solution extends ConceptDraw DIAGRAM software with templates, samples and libraries of vector stencils for drawing the data flow diagrams (DFD).
This vector stencils library contains 195 cloud computing icons.
Use it to design cloud computing infographic and diagrams with ConceptDraw PRO software.
"Cloud computing, also on-demand computing, is a kind of Internet-based computing that provides shared processing resources and data to computers and other devices on demand. It is a model for enabling ubiquitous, on-demand access to a shared pool of configurable computing resources (e.g., networks, servers, storage, applications and services), which can be rapidly provisioned and released with minimal management effort. Cloud computing and storage solutions provide users and enterprises with various capabilities to store and process their data in third-party data centers.
Cloud computing has become a highly demanded service or utility due to the advantages of high computing power, cheap cost of services, high performance, scalability, accessibility as well as availability." [Cloud computing. Wikipedia]
The vector stencils library "Cloud clipart" is included in the Cloud Computing Diagrams solution from the Computer and Networks area of ConceptDraw Solution Park.
 Business Diagrams Package
Business Diagrams Package is a large set of comprehensive graphical solutions from the ConceptDraw Solution Park, which are powerful in solving the business, marketing and quality tasks in completely different fields, such as finance, education, health food and cooking, HR, and many others. The tools of this package's solutions are a powerful assistant in drawing all diversity of Financial and Marketing infographics, Business process workflow diagrams, Organizational charts, Education infographics, Quality diagrams, Health food diagrams, HR flowcharts, as well as different graphics and charts, which depict the values of key business indicators, their dependencies, give the full understanding of a situation within a company and on the market.
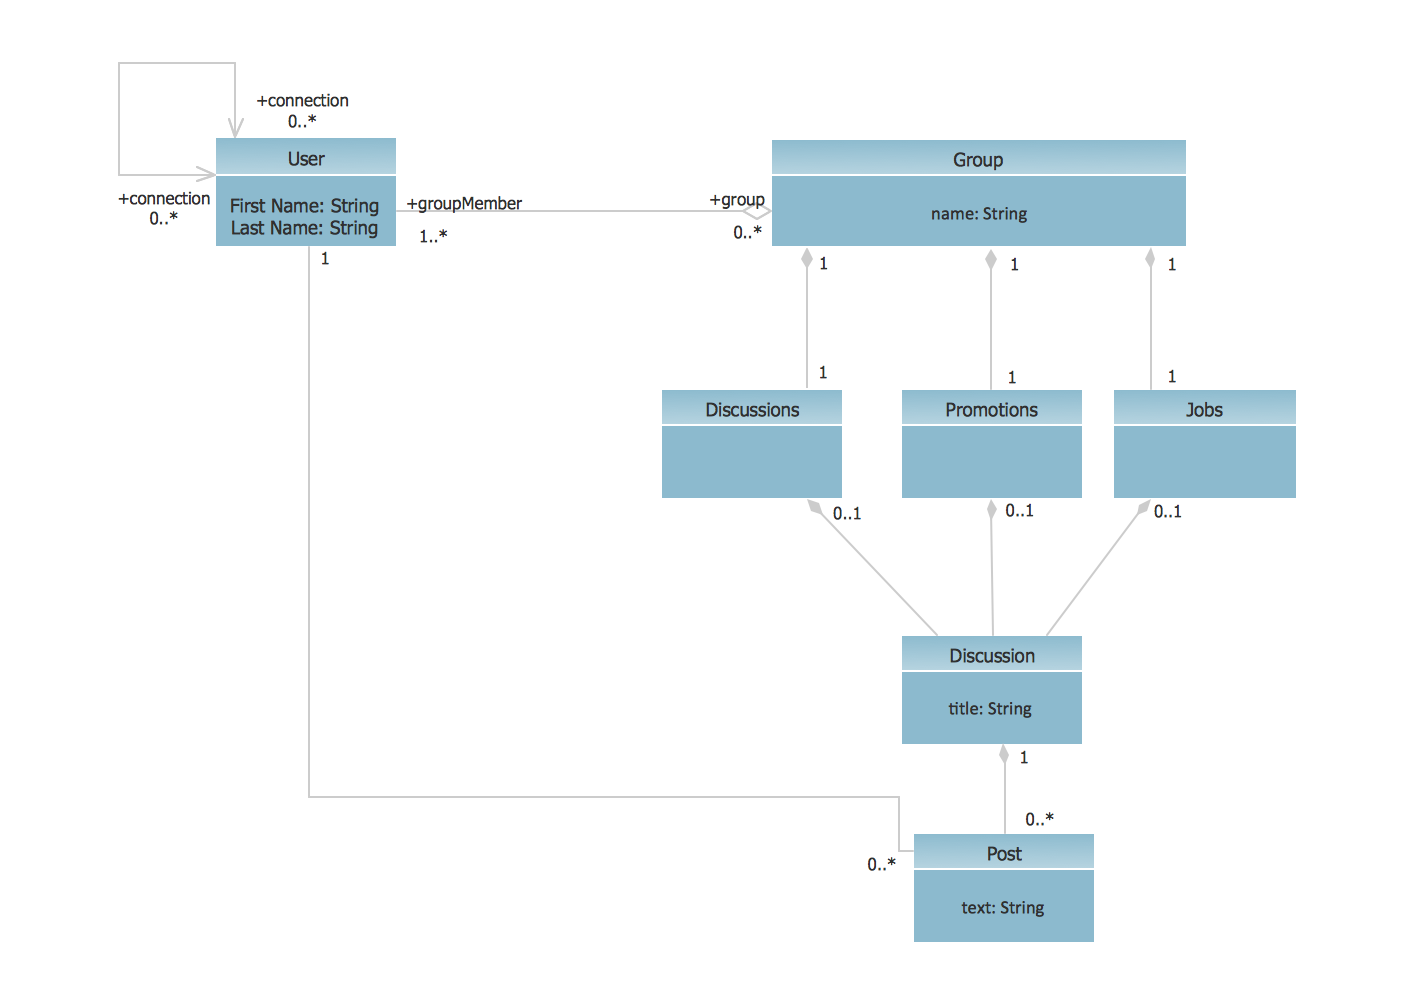
UML Class Diagram Example - Social Networking Site
UML Diagrams Social Networking Sites Project. This sample was created in ConceptDraw DIAGRAM diagramming and vector drawing software using the UML Class Diagram library of the Rapid UML Solution from the Software Development area of ConceptDraw Solution Park. This sample shows the structure of the popular social networking site Linkedin and is used in the business field, in IT, at the projection and creating of the social networking sites.Pyramid Diagram
The Time-Money-Quality Triangle illustrates an advertising truism, that you can't have all three.- Activity Diagram For Atm Fund Transfer
- ATM UML Diagrams | Business Process Workflow Diagrams | Social ...
- UML activity diagram - Payment process | ATM UML Diagrams ...
- UML activity diagram - Payment process | ATM UML Diagrams ...
- Wireless Networks | Activity Diagram Transfer Atm
- ATM UML Diagrams | Rapid UML | Component Diagram Online ...
- Swimlane Diagram Atm Transfer Money
- Dfd Diagram Money Transfer System
- UML activity diagram - Payment process | UML activity diagram ...
- Sequence Diagram Transfer Money
- UML activity diagram - Cash withdrawal from ATM | ATM UML ...
- ATM UML Diagrams | Think. Act. Accomplish. | Money Transfer ...
- ATM UML Diagrams | Component Diagram For Online Money Transfer
- UML activity diagram - Payment process | UML activity diagram ...
- ATM UML Diagrams | Online Money Transfer Through E Banking ...
- UML activity diagram - Cash withdrawal from ATM | UML Activity ...
- Data Flow Diagrams (DFD) | Dfd Process Money Transfer On Phone
- UML activity diagram - Payment process | Payment Method Activity ...
- Bank ATM use case diagram
- ATM UML Diagrams | Mobile Money Usecase Diagram






-cloud-clipart---vector-stencils-library.png--diagram-flowchart-example.png)
-cloud-clipart---vector-stencils-library.png--diagram-flowchart-example.png)


-cloud-clipart---vector-stencils-library.png--diagram-flowchart-example.png)


-cloud-clipart---vector-stencils-library.png--diagram-flowchart-example.png)
-cloud-clipart---vector-stencils-library.png--diagram-flowchart-example.png)


