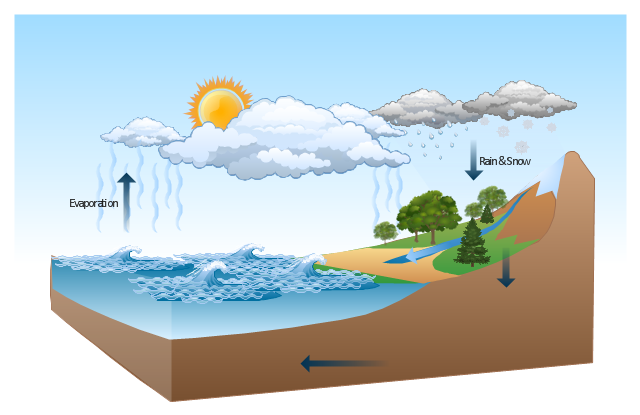
This Water cycle diagram example was drawn using the ConceptDraw PRO diagramming and vector graphics software extended with the clipart libraries Geography and Weather.
"The water cycle, also known as the hydrologic cycle or the H2O cycle, describes the continuous movement of water on, above and below the surface of the Earth. The mass water on Earth remains fairly constant over time but the partitioning of the water into the major reservoirs of ice, fresh water, saline water and atmospheric water is variable depending on a wide range of climatic variables. The water moves from one reservoir to another, such as from river to ocean, or from the ocean to the atmosphere, by the physical processes of evaporation, condensation, precipitation, infiltration, runoff, and subsurface flow. In so doing, the water goes through different phases: liquid, solid (ice), and gas (vapor)." [Water cycle. Wikipedia]
This water cycle diagram example is included in the Nature solution from the Illustration area of ConceptDraw Solution Park.
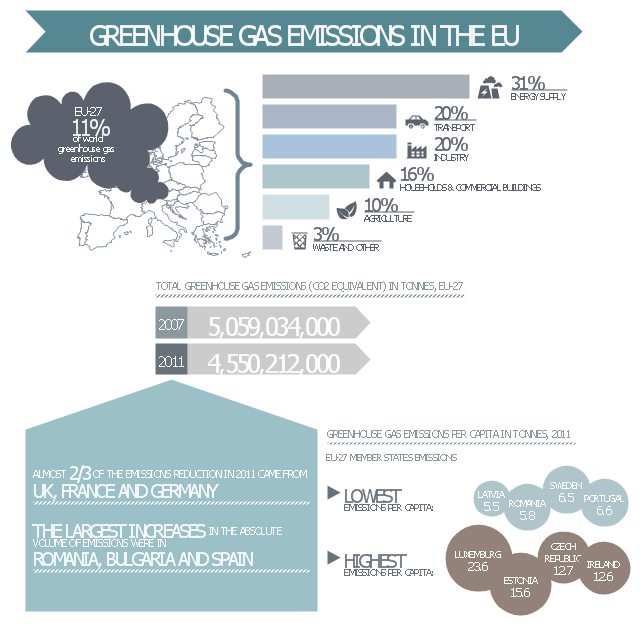
This ecology infographic example was created on the base of the infographics "Greenhouse gas emissions in the EU" from the Debating Europe website. [debatingeurope.eu/ wp-content/ uploads/ 2013/ 06/ TH_ 2_ social.png]
"A greenhouse gas (sometimes abbreviated GHG) is a gas in an atmosphere that absorbs and emits radiation within the thermal infrared range. This process is the fundamental cause of the greenhouse effect. The primary greenhouse gases in the Earth's atmosphere are water vapor, carbon dioxide, methane, nitrous oxide, and ozone. Greenhouse gases greatly affect the temperature of the Earth; without them, Earth's surface would average about 33 °C colder, which is about 59 °F below the present average of 14 °C (57 °F)." [Greenhouse gas. Wikipedia]
The ecology infographic example "EU greenhouse gas emissions" was created using the ConceptDraw PRO diagramming and vector drawing software extended with the Management Infographics solition from the area "Business Infographics" in ConceptDraw Solution Park.
Used Solutions
- Atmosphere air composition | EU greenhouse gas emissions ...
- Water cycle diagram | Swim Lane Diagrams | EU greenhouse gas ...
- Atmosphere air composition | CERES data flow diagram ...
- Atmosphere air composition | Percentage Pie Chart. Pie Chart ...
- Gas Chart In Atmosphere Flowchart
- Atmosphere air composition | EU greenhouse gas emissions ...
- Water cycle diagram | EU greenhouse gas emissions - Management ...
- Atmosphere air composition | Bar Diagram Math | Process Flow ...
- Atmosphere air composition | Process Flowchart - Draw Process ...
- Atmosphere air composition | Pie Chart For Air Gas
- Gas Example Drawing
- EU greenhouse gas emissions - Management infogram | Water ...
- Atmosphere air composition | EU greenhouse gas emissions ...
- Atmosphere air composition | Design elements - Composition charts ...
- Approximate composition of the air - Pie chart | Bar Diagram Math ...
- CERES data flow diagram | Resources and energy - Vector stencils ...
- Atmosphere air composition | Approximate composition of the air ...
- Percentage Pie Chart. Pie Chart Examples | TQM Diagram Tool ...
- Carbon Dioxide In Persentage Earth Atmosphere
- Pie Diagram On Composition Of Different Gases Present In The ...

