HelpDesk
How to Draw Maps of Australia
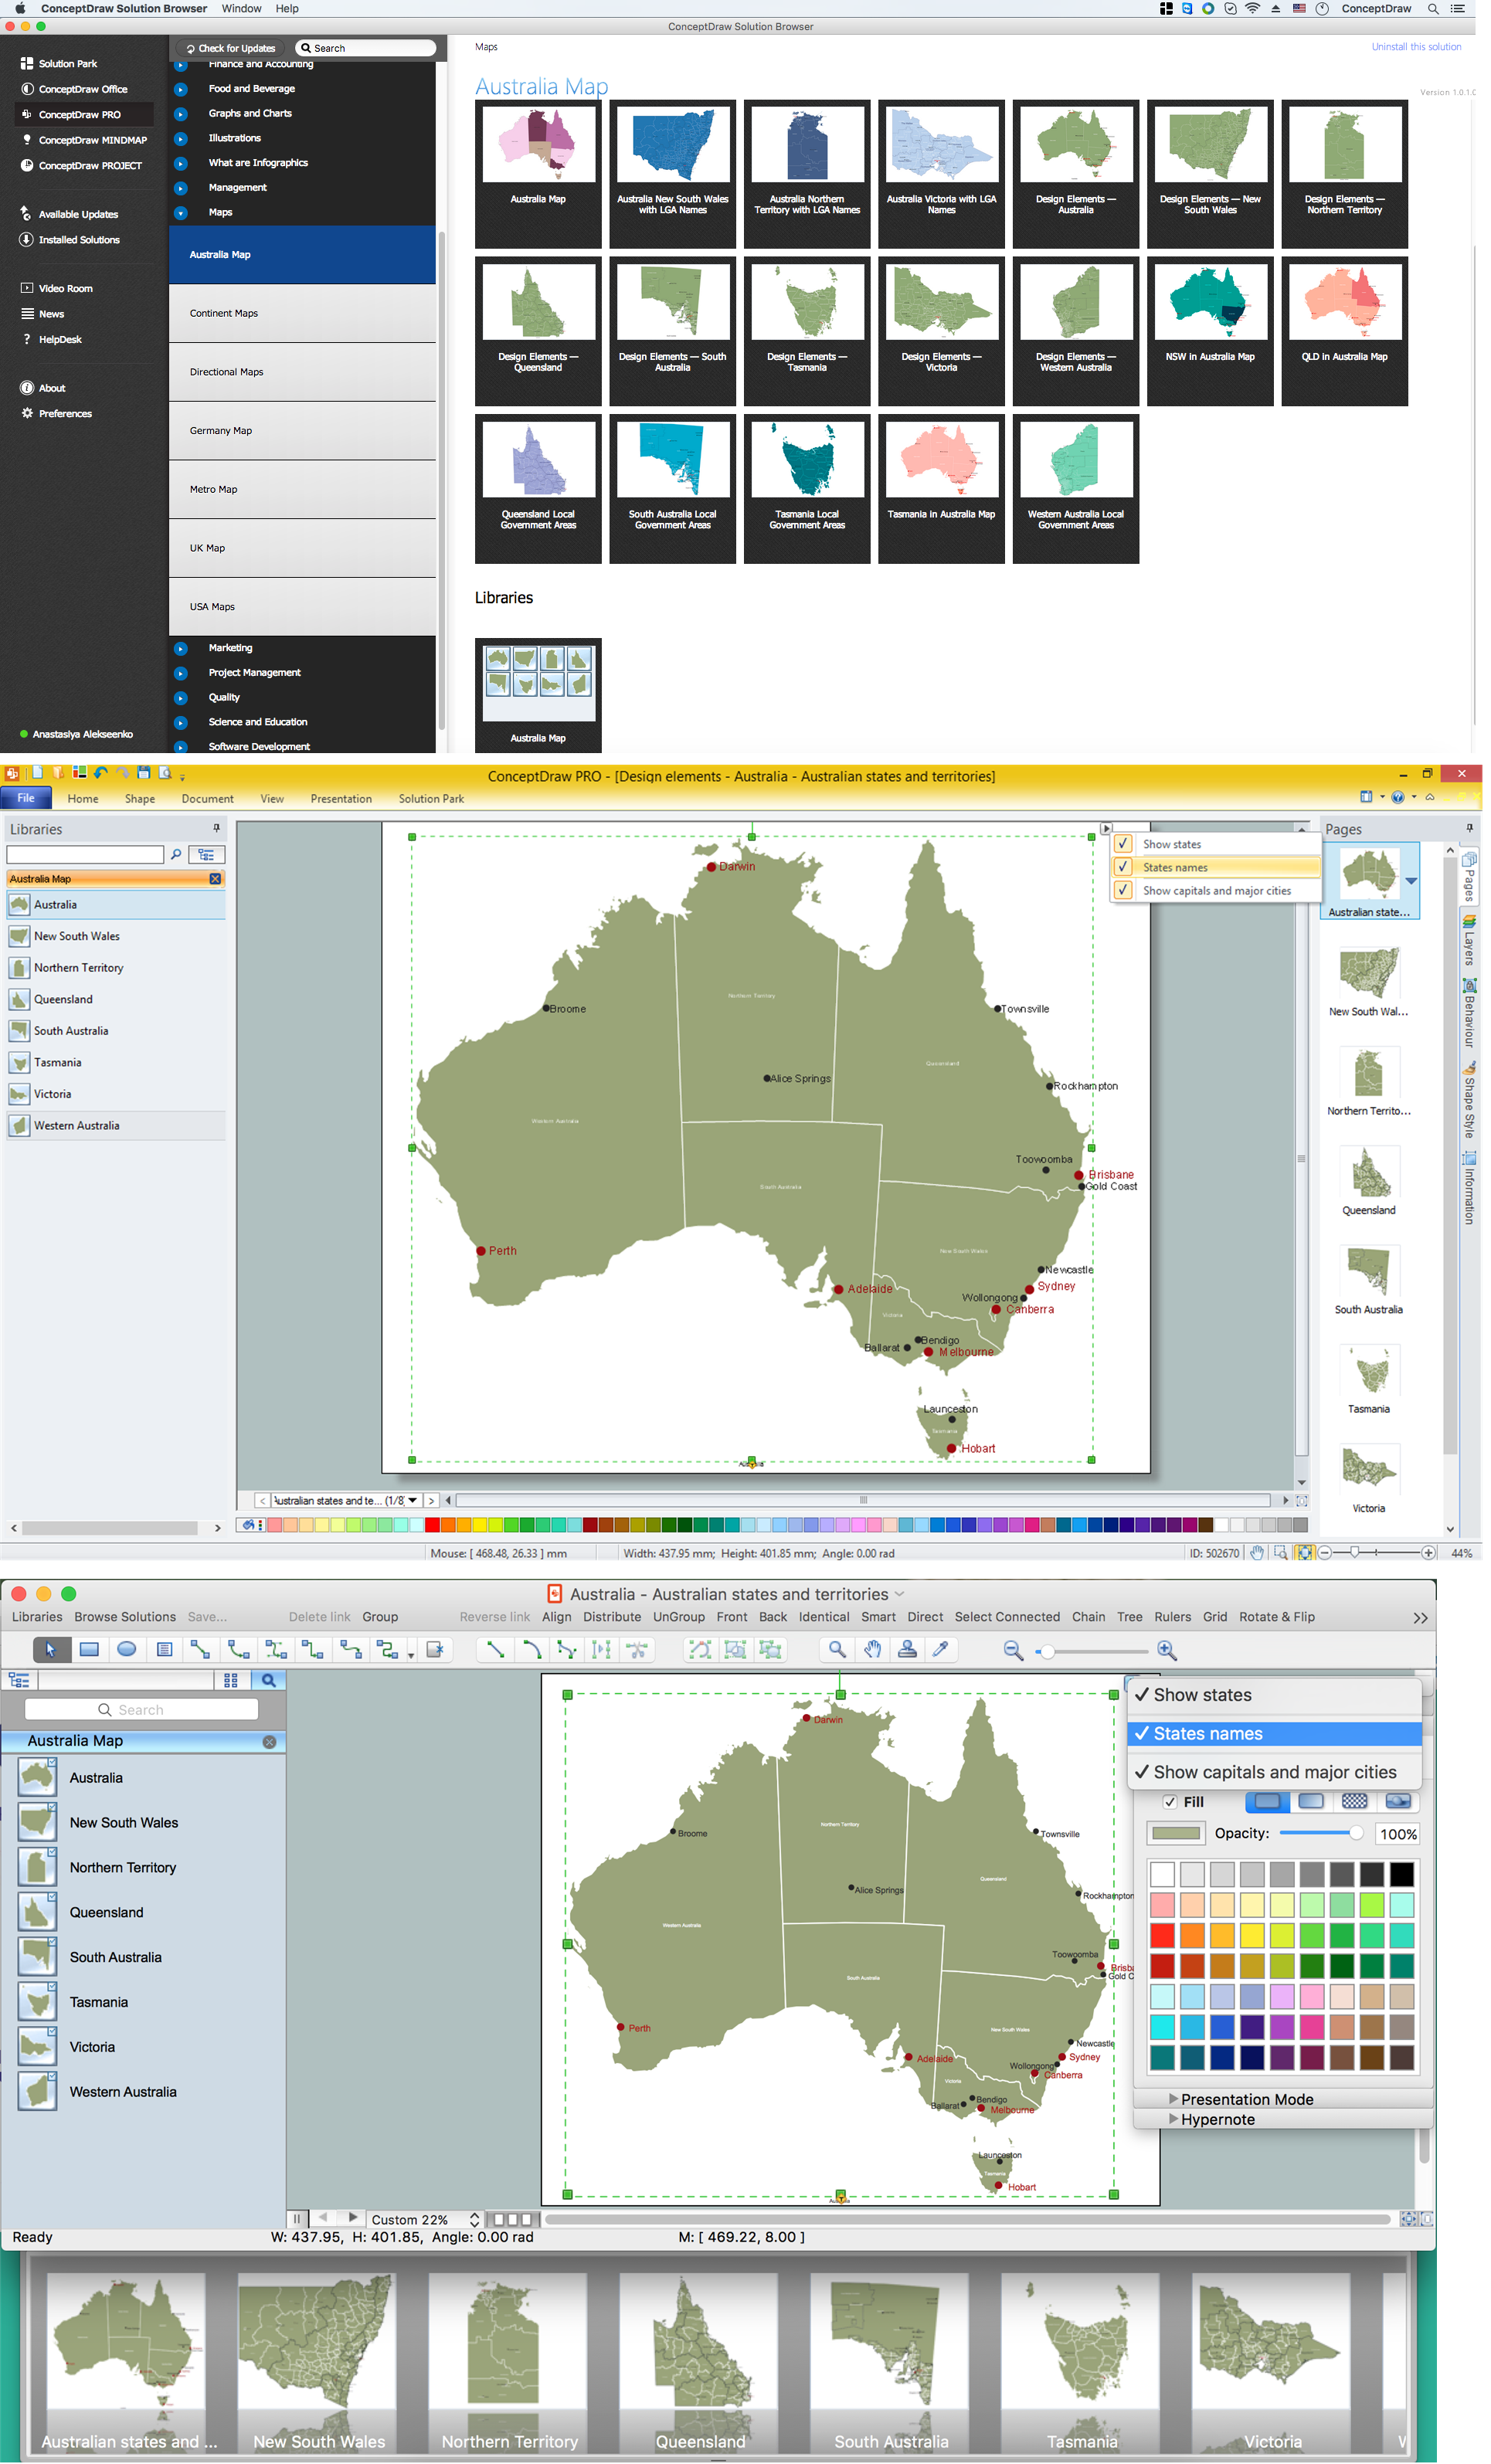
Australia is the sixth largest country in the world. Australia consists from the mainland which is surrounded by many thousands of small fringing islands and numerous larger ones. The vast territories, aligned with interesting historic features across a wide expanse, make the thematic map an ideal way of depicting geographical, geological and political information related to Australia.The Australia Map solution for ConceptDraw PRO will help you to make the steps of the creativeness easy and intuitive. The Australia Map solution provides templates and samples along with vector stencils to get you started. Used together with other ConceptDraw PRO solutions it will allow you to create comprehensive geography-related infographics.
 Australia Map
For graphic artists creating accurate maps of Australia. The Australia Map solution - allows designers to map Australia for their needs, offers a collection of scalable graphics representing the political geography of Australia, split into distinct state
Australia Map
Maps surround us everywhere in our life, study, work, traveling, they are widely used in geography, history, politics, economics, and many other fields of science and life activity. But designing of maps is usually complex and labor-intensive process. Now we have the possibility to make easier this process - ConceptDraw PRO diagramming and vector drawing software extended with Australia Map Solution from the Maps Area of ConceptDraw Solution Park will help us in easy drawing detailed Australia map.
 Continent Maps
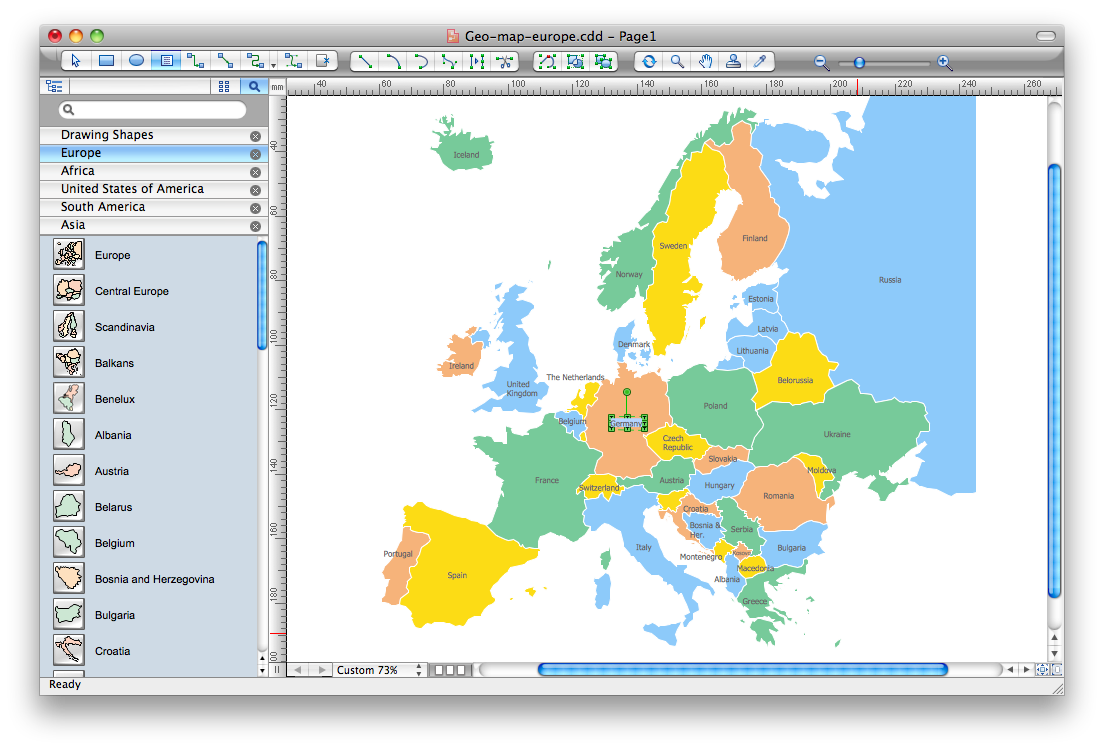
Continent Maps solution extends ConceptDraw PRO software with templates, samples and libraries of vector stencils for drawing the thematic maps of continents, state maps of USA and Australia.
 Pie Charts
Pie Charts are extensively used in statistics and business for explaining data and work results, in mass media for comparison (i.e. to visualize the percentage for the parts of one total), and in many other fields. The Pie Charts solution for ConceptDraw PRO v10 offers powerful drawing tools, varied templates, samples, and a library of vector stencils for simple construction and design of Pie Charts, Donut Chart, and Pie Graph Worksheets.
How To use House Electrical Plan Software
How we can conduct the electricity at house correctly without a plan? It is impossible. The House electrical diagram depicts locations of switches, outlets, dimmers and lights, and lets understand how you will connect them. But design of House Electrical Plan looks a complex task at a glance, which requires a lot of tools and special experience. But now all is simple with all-inclusive floor plan software - ConceptDraw PRO. As a house electrical plan software, the ConceptDraw PRO contains libraries with a large range of professional lighting and electrical symbols, ready-to-use electrical plans samples and examples, and built-in templates for creating great-looking Home floor electrical plans. It is a fastest way to draw Electrical circuit diagrams, Electrical wiring and Circuit schematics, Digital circuits, Electrical equipment, House electrical plans, Satellite television, Cable television, Home cinema, Closed-circuit television when are used the tools of Electric and Telecom Plans Solution from ConceptDraw Solution Park. Files created in Visio for Mac app can be easily imported to ConceptDraw PRO. Also you may import stencils and even libraries. Try for free an alternative to Visio that Apple users recommend.
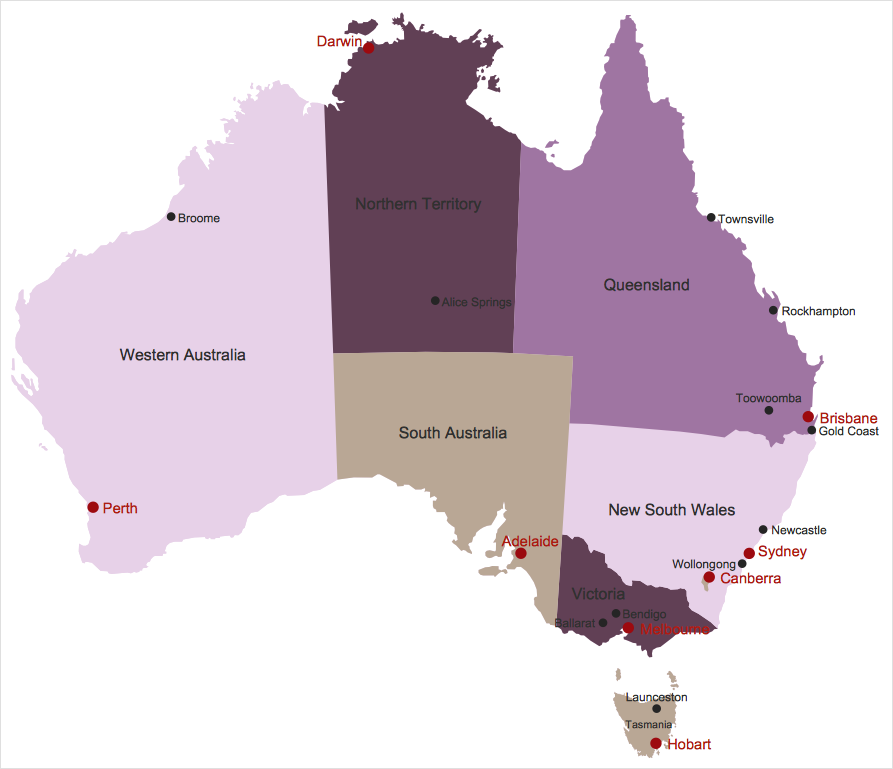
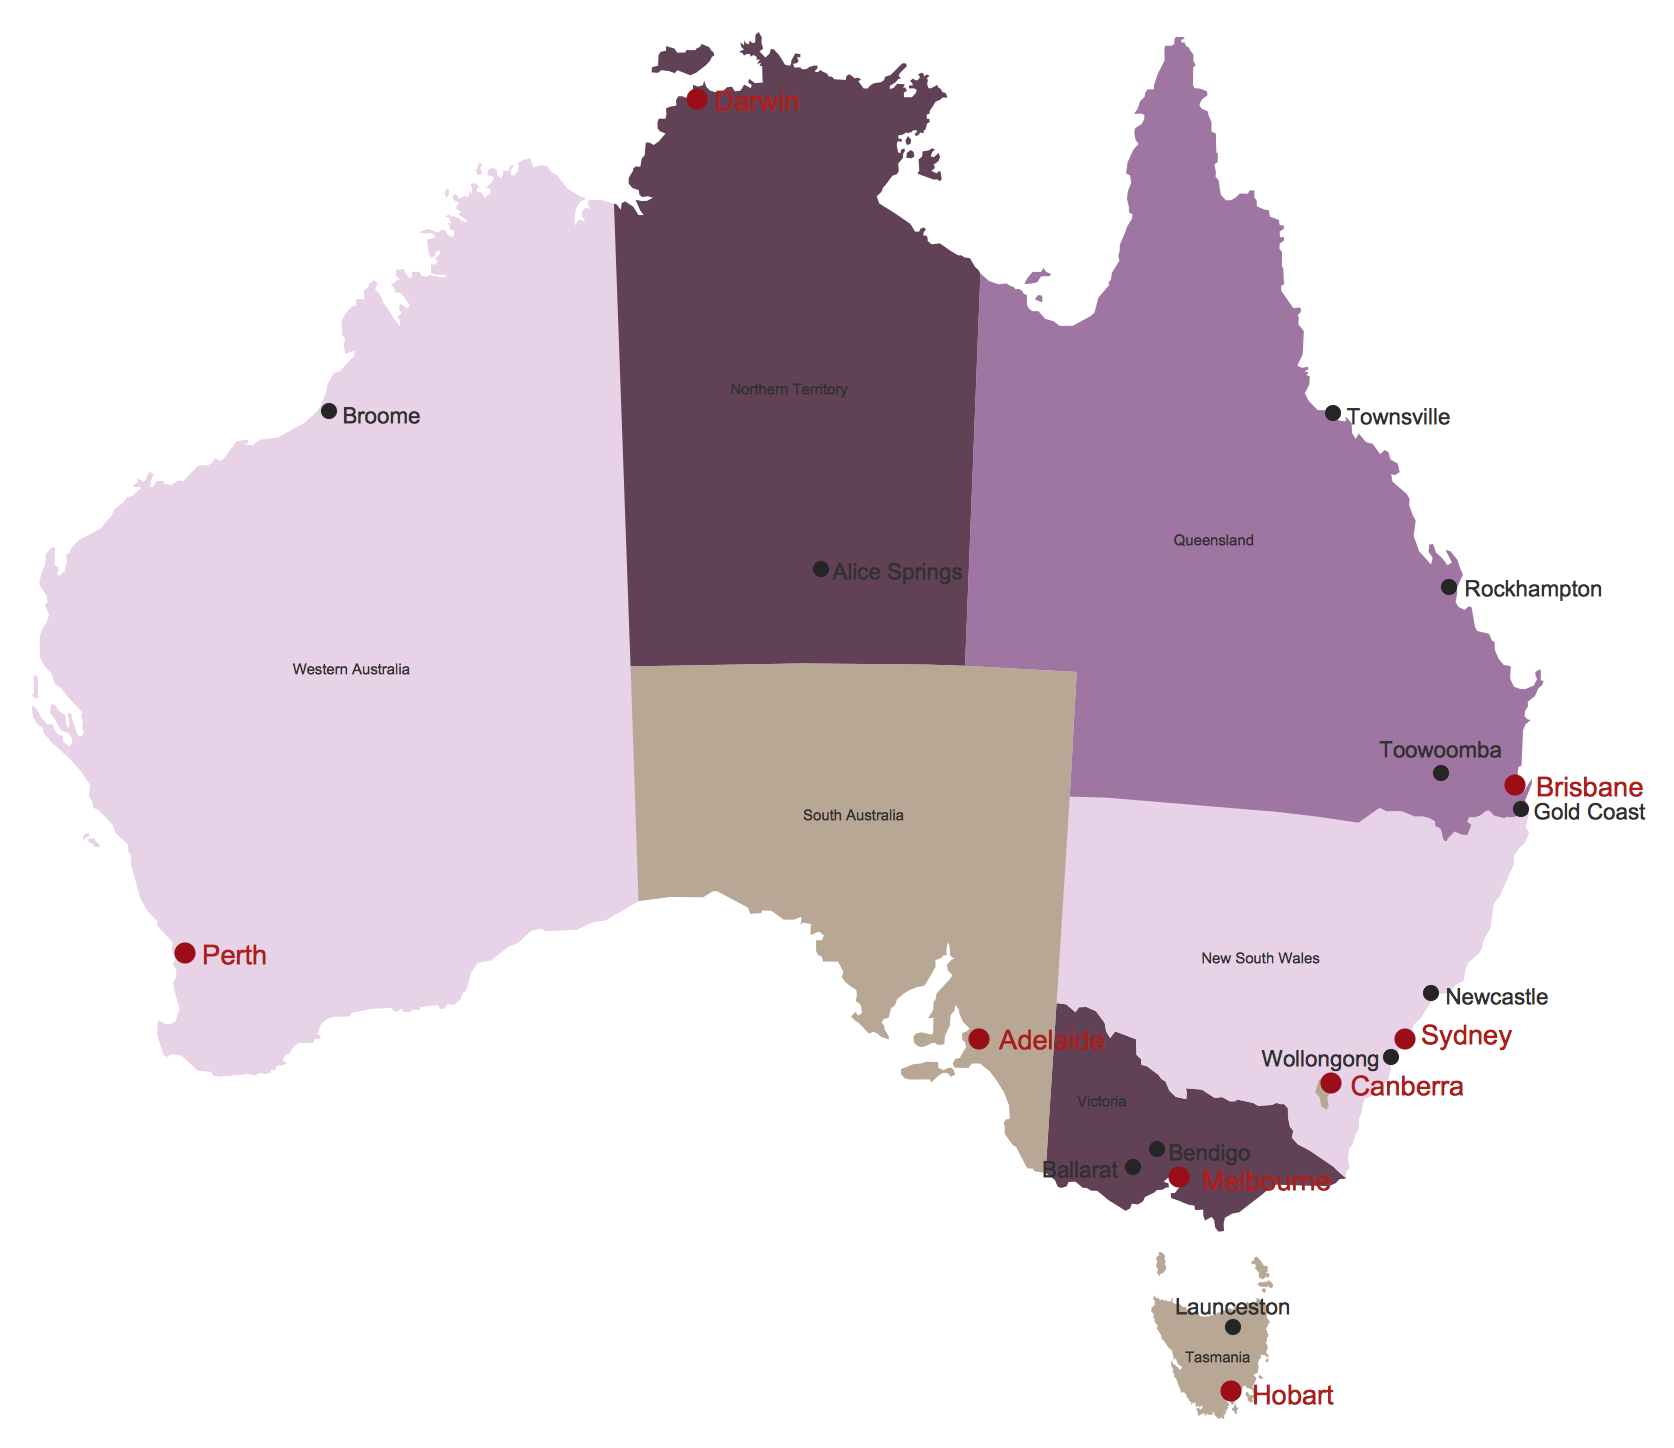
Australia Map — States and Cities
Maps surround us everywhere in our life, study, work, traveling, they are widely used in geography, history, politics, economics, and many other fields of science and life activity. But designing of maps is usually complex and labor-intensive process. Now we have the possibility to make easier this process - ConceptDraw PRO diagramming and vector drawing software extended with Australia Map Solution from the Maps Area of ConceptDraw Solution Park will help us in easy drawing detailed Australia map.Map Software
Create maps, flags, and more with ConceptDraw
 USA Maps
Use the USA Maps solution to create a map of USA, a US interstate map, printable US maps, US maps with cities and US maps with capitals. Create a complete USA states map.
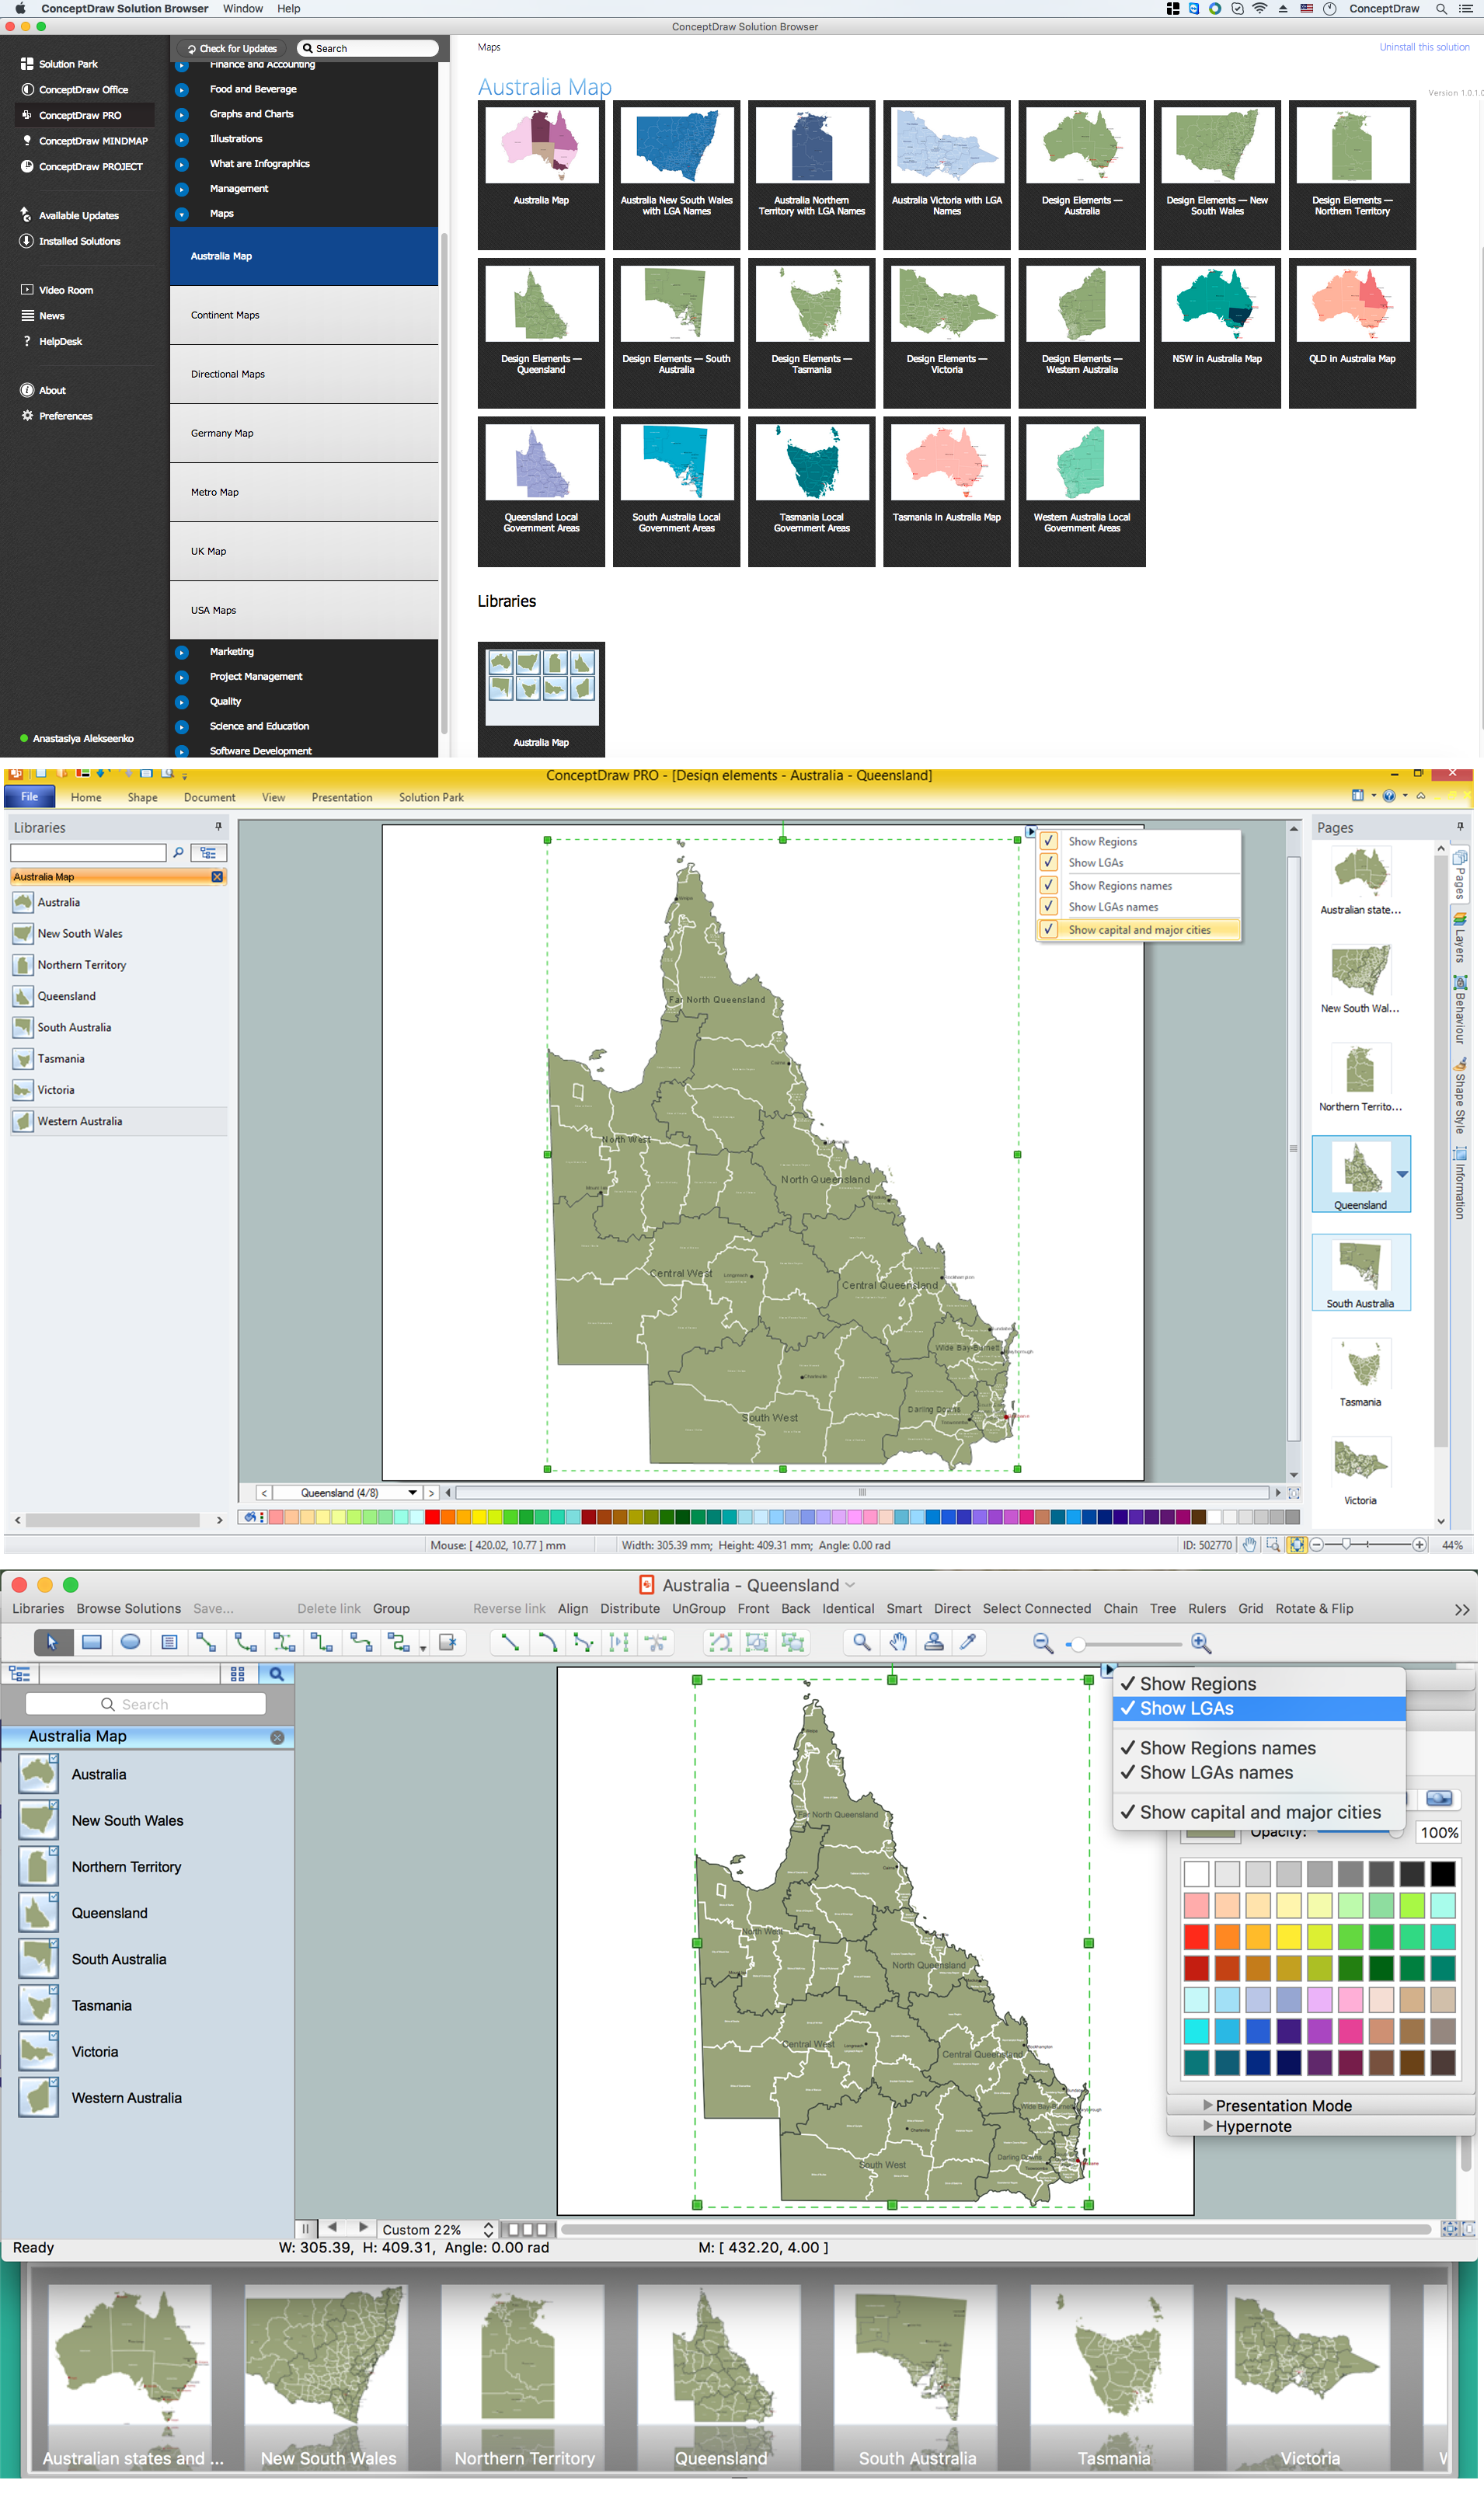
Australia Map — Queensland
Queensland (abbreviated as Qld) is the second-largest and third-most-populous state in Australia. Maps surround us everywhere in our life, study, work, traveling, they are widely used in geography, history, politics, economics, and many other fields of science and life activity. But designing of maps is usually complex and labor-intensive process. Now we have the possibility to make easier this process - ConceptDraw PRO diagramming and vector drawing software extended with Australia Map Solution from the Maps Area of ConceptDraw Solution Park will help us in easy drawing detailed Australia map.
 Area Charts
Area Charts are used to display the cumulative totals over time using numbers or percentages; or to show trends over time among related attributes. The Area Chart is effective when comparing two or more quantities. Each series of data is typically represented with a different color, the use of color transparency in an object’s transparency shows overlapped areas and smaller areas hidden behind larger areas.
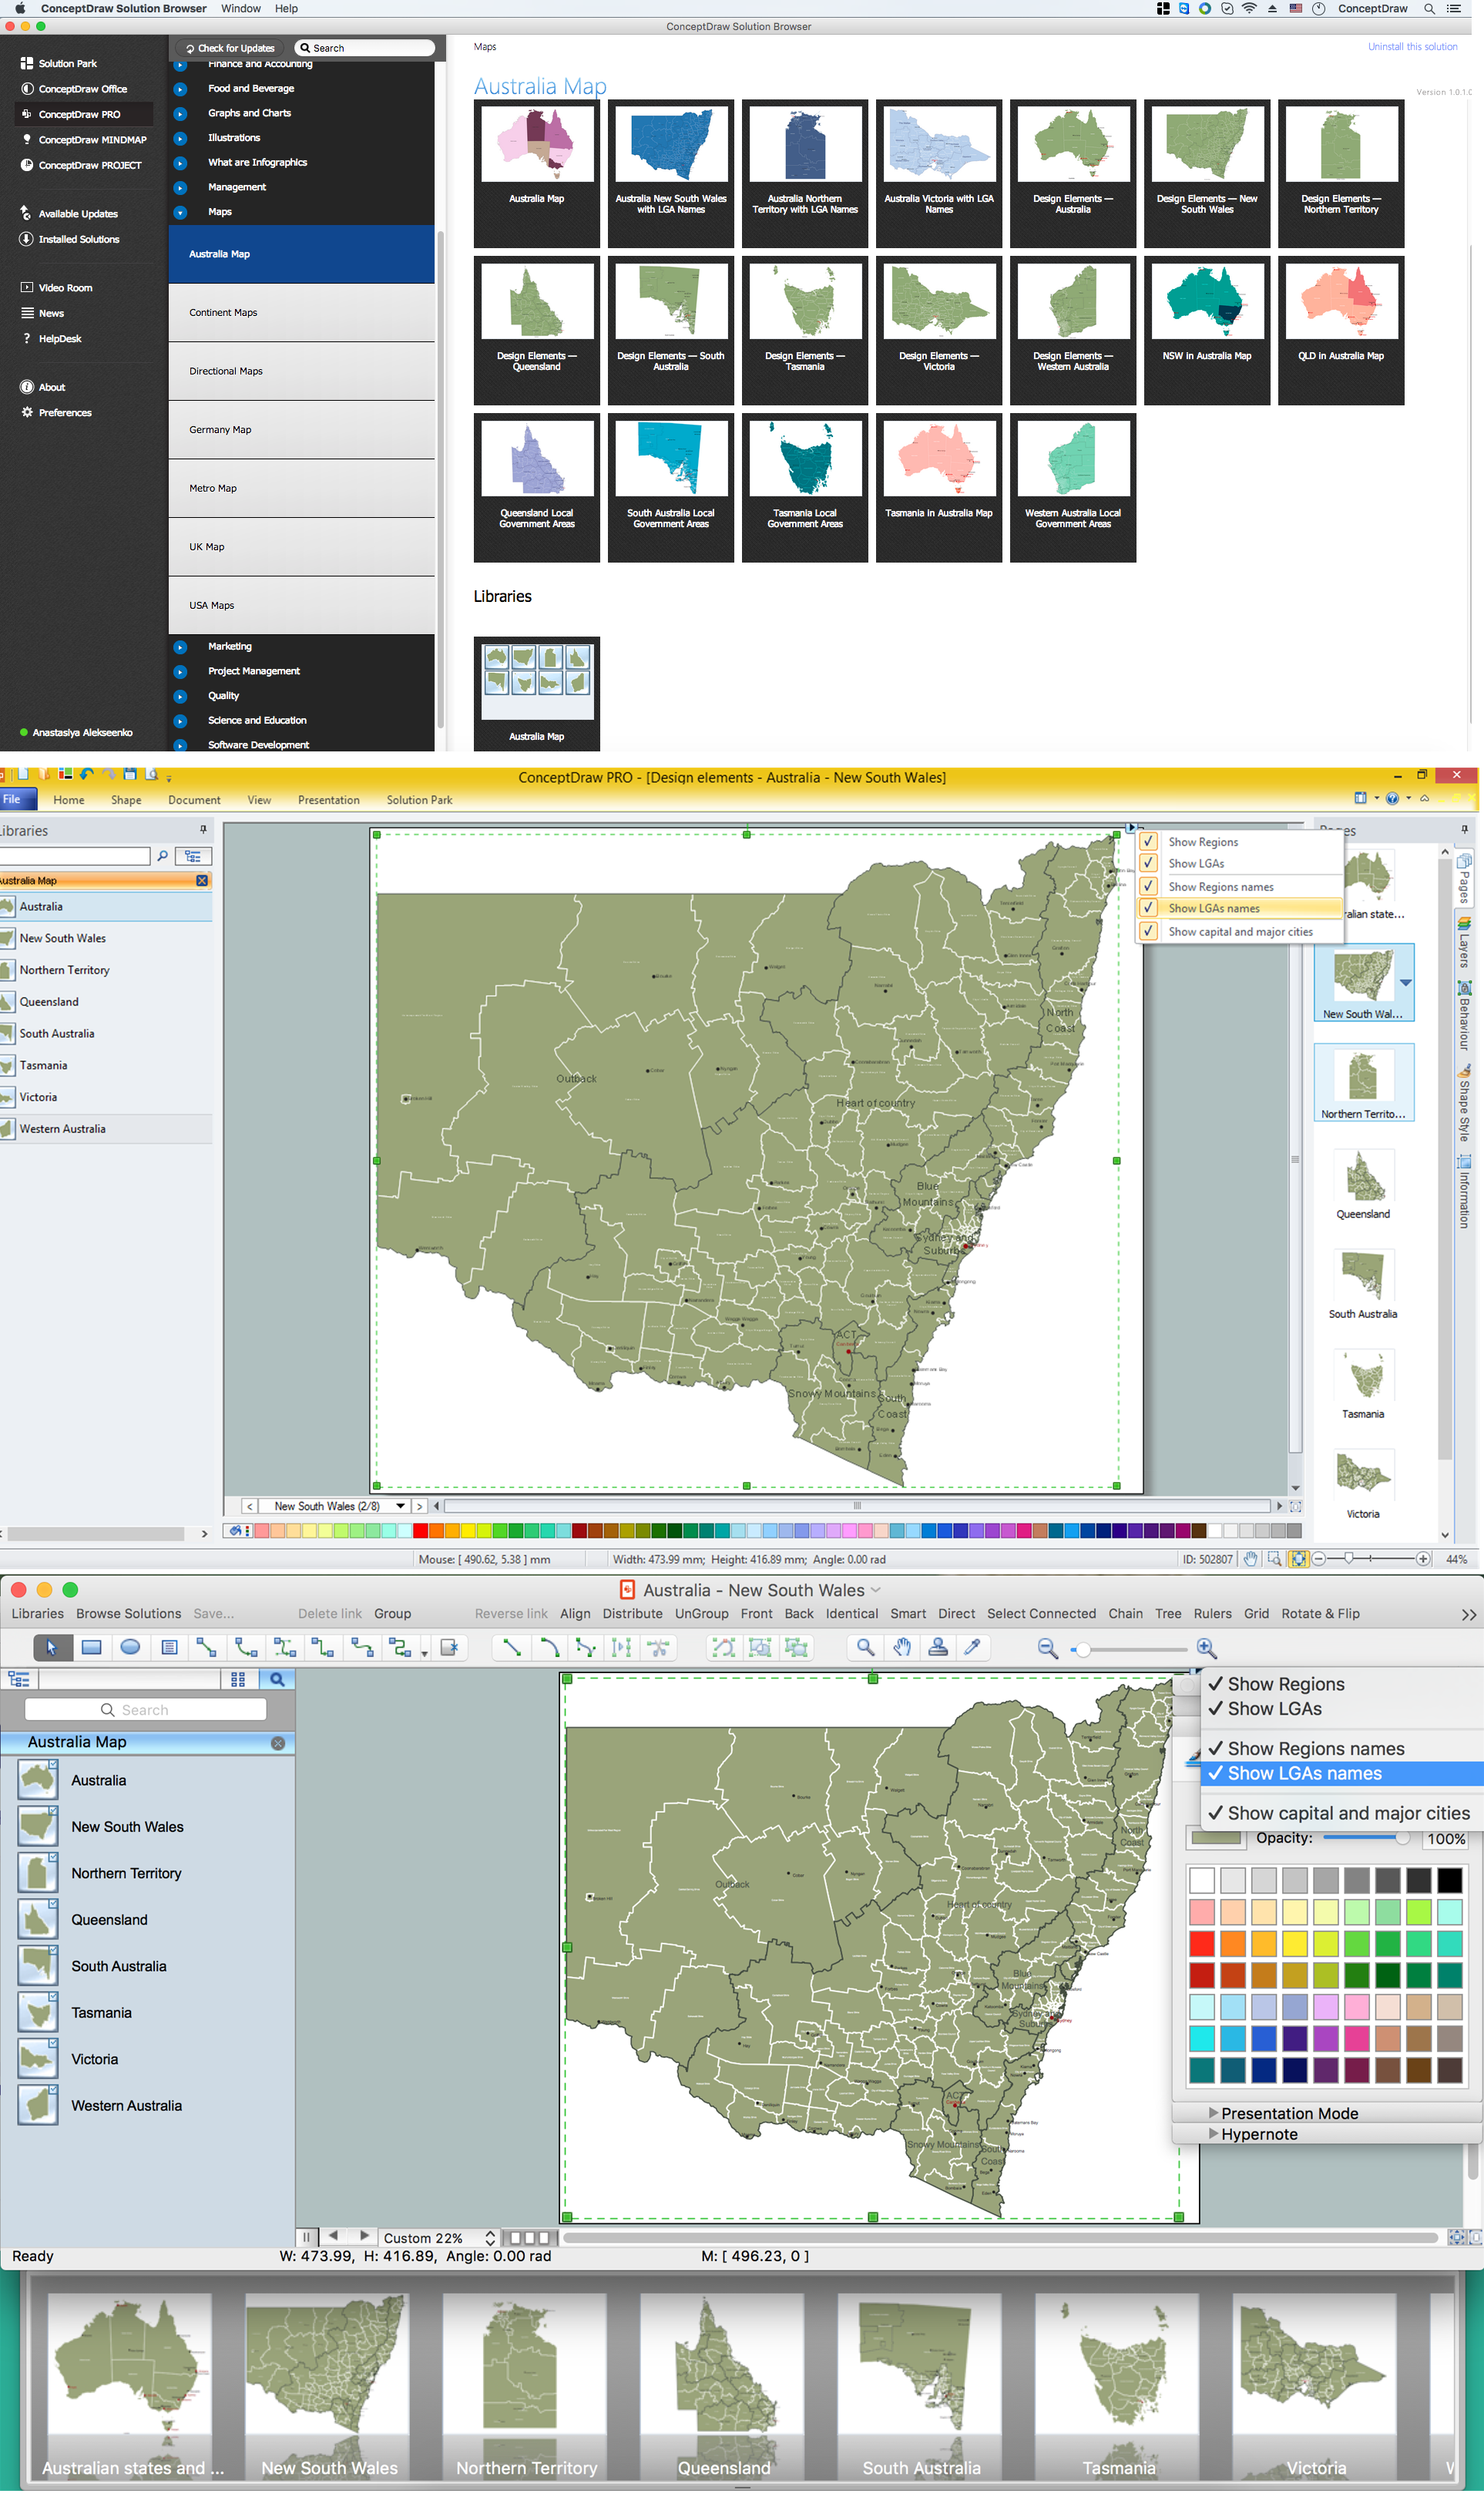
Australia Map — New South Wales
New South Wales (abbreviated as NSW) is a state on the east coast of Australia. Maps surround us everywhere in our life, study, work, traveling, they are widely used in geography, history, politics, economics, and many other fields of science and life activity. But designing of maps is usually complex and labor-intensive process. Now we have the possibility to make easier this process - ConceptDraw PRO diagramming and vector drawing software extended with Australia Map Solution from the Maps Area of ConceptDraw Solution Park will help us in easy drawing detailed Australia map.3 Circle Venn. Venn Diagram Example
This example shows the 3 Circle Venn Diagram. The Venn Diagrams visualize all possible logical intersections between several sets. On this example you can see the intersections of 3 sets. Venn Diagrams are widely used in mathematics, logic, statistics, marketing, sociology, etc.- Australia map with cities - Template | Australia map - Template ...
- Australia Map | Geo Map - Australia - New Zealand | How to Draw ...
- Australia map with cities - Template | Australia map - Template ...
- Australia Map | USA Maps | Pie Charts | Australia Map Colours
- Basic Diagramming | Line Chart Examples | Geo Map - Australia ...
- How to Draw Maps of Australia Using ConceptDraw PRO | Geo Map ...
- Australia states time zones - Thematic map | Design elements ...
- Constellation Chart | Basic Venn Diagrams | Australia Map ...
- Line Chart Template for Word | How to Split a Complex Map to a ...
- Examples of Flowcharts, Org Charts and More | Australia Map ...
- Basketball | Sport Field Plans | Australia Map | Basketball Court ...
- Pyramid Diagram | How to Operate with Project Time Frames in ...
- Australia states time zones - Thematic map | WLAN | How to Create ...
- How To Create a MS Visio Workflow Diagram Using ConceptDraw ...
- Computer Network Diagrams | ConceptDraw Solution Park | Process ...
- Seating Plans | Pie Charts | How to Design a Fast-Food Restaurant ...
- Line Chart Examples | Line Graph | Pictures of Graphs | Population ...
- Chemistry | Organic Chemistry Symbols | School and Training Plans ...
- Organization chart - Foodbank | Examples of Flowcharts, Org Charts ...
- Aerospace and Transport | Spider Chart Template | Vehicular ...
