 AWS Architecture Diagrams
AWS Architecture Diagrams with powerful drawing tools and numerous predesigned Amazon icons and AWS simple icons is the best for creation the AWS Architecture Diagrams, describing the use of Amazon Web Services or Amazon Cloud Services, their application for development and implementation the systems running on the AWS infrastructure. The multifarious samples give you the good understanding of AWS platform, its structure, services, resources and features, wide opportunities, advantages and benefits from their use; solution’s templates are essential and helpful when designing, description and implementing the AWS infrastructure based systems. Use them in technical documentation, advertising and marketing materials, in specifications, presentation slides, whitepapers, datasheets, posters, etc.
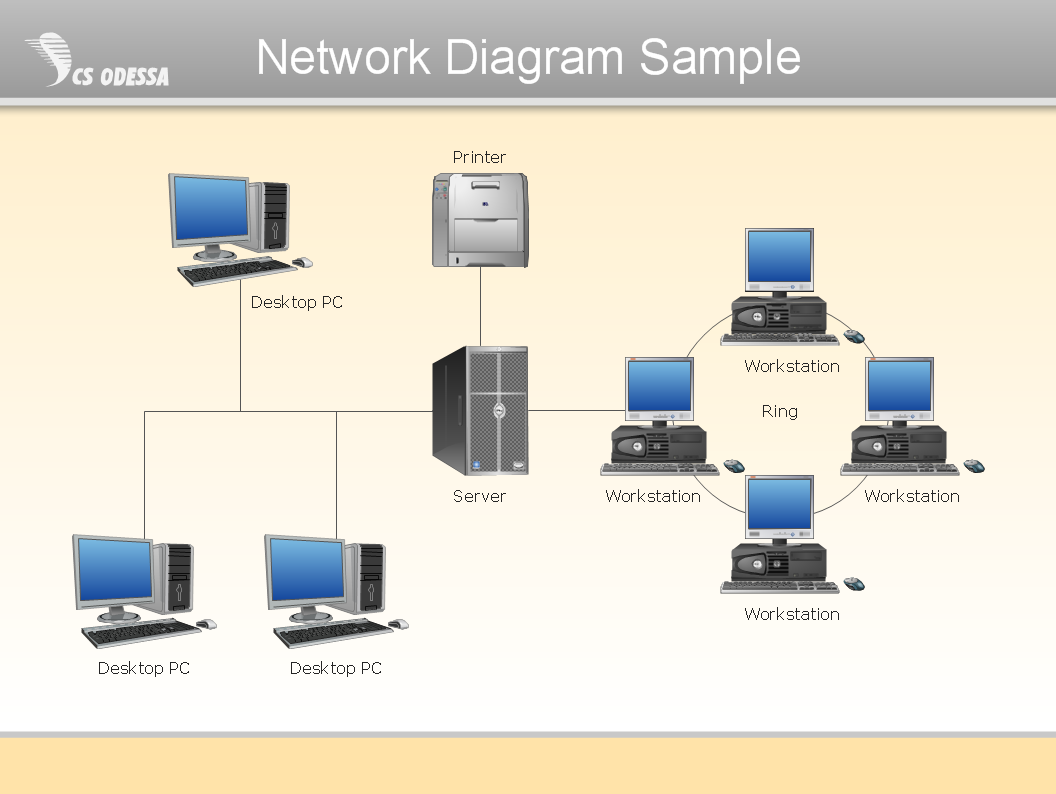
Network Diagram Software Physical Network Diagram
ConceptDraw Network Diagram Software is ideal for network engineers and network designers who need to draw Physical Network Diagrams.
 Entity-Relationship Diagram (ERD)
An Entity-Relationship Diagram (ERD) is a visual presentation of entities and relationships. That type of diagrams is often used in the semi-structured or unstructured data in databases and information systems. At first glance ERD is similar to a flowch
 Entity-Relationship Diagram (ERD)
Entity-Relationship Diagram (ERD) solution extends ConceptDraw PRO software with templates, samples and libraries of vector stencils from drawing the ER-diagrams by Chen's and crow’s foot notations.
HelpDesk
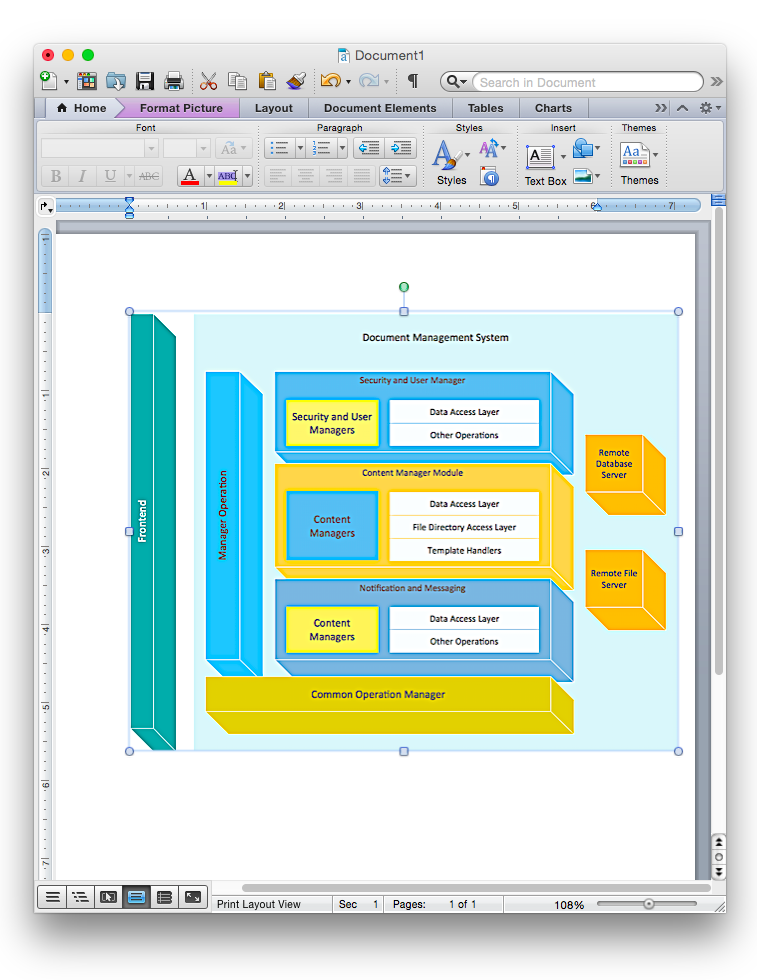
How to Add a Block Diagram to a MS Word ™ Document Using ConceptDraw PRO
Block diagram consists from graphic blocks. Blocks are connected by lines or arrows. Block diagrams are used to show the relationship between parts of some systems. It can be used for the development of new systems or to improve existing ones. The structure of block diagram gives a high-level overview of the major components of the system, as well as the important relationships. Using the block diagrams, you can more effectively present the business data contained in your MS Word documents. ConceptDraw PRO allows you to easily create block diagrams and then insert them into a MS Word document.HelpDesk
How to Create an ERD Diagram
ERD (entity relationship diagram) is used to show the logical structure of databases. It represents the interrelationships between components of database (entities). Entity relationship diagrams are a widely used in software engineering. Using ERD software engineers can control the every aspect of database development. ER diagram can be used as guide for testing and communicating before the release of software product. ERD displays data as entities that are connected with connections that show the relationships between entities. There is some ERD notations used by data bases developers for representing the relationships between the data objects. ConceptDraw PRO and its ERD solution allow you to build ERD diagram of any notation.- Iot Flow Diagram
- AWS Architecture Diagrams | ER Diagram for Cloud Computing ...
- The Newest Edition of ConceptDraw AWS Architecture Diagrams
- Iot Flowchart And Diagrams On Its Application Areas
- UML Diagram | UML Diagram Types List | AWS Architecture ...
- Principal cloud manufacturing | AWS Architecture Diagrams ...
- AWS Architecture Diagrams | Iot Smart Home Data Flow Diagram
- Simple Flowchart For Iot
- AWS Architecture Diagrams | Network Diagram Software Physical ...
- AWS Architecture Diagrams | Functional Block Diagram | Entity ...
- Principal cloud manufacturing | AWS Architecture Diagrams | How to ...
- UML Diagram | UML Diagram Types List | AWS Architecture ...
- Smart Architecture Flowchart
- AWS Architecture Diagrams | Concept Maps | Personal area (PAN ...
- AWS Architecture Diagrams | Bubble diagrams in Landscape ...
- Principal cloud manufacturing | AWS Architecture Diagrams | How to ...
- AWS Architecture Diagrams | How to Add a Block Diagram to a MS ...
- AWS Architecture Diagrams | Basic Flowchart Symbols and Meaning ...
- AWS Architecture Diagrams | Fair Alarm System Using Iot Microsoft ...
- Working Of Iot With The Help Of Flow Chart


