Bubble diagrams with ConceptDraw PRO
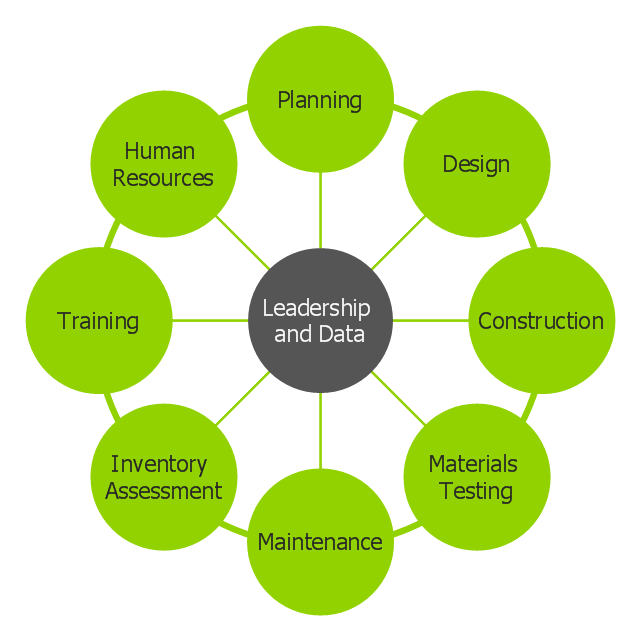
Using ConceptDraw you will be able to create bubble diagrams from the ready ConceptDraw library objects or make your own objects. The created diagram can be saved and edited, objects can be moved and links between them will be automatically repainted after object moving because of using the ConceptDraw connectors.This circle-spoke diagram example was created on the base of illustration of article "Beyond the Short Term: Transportation Asset Management for Long-Term Sustainability, Accountability and Performance" from the website of The Federal Highway Administration (FHWA).
"Leadership and data provide essential coordination of other functions in an asset management environment. Leadership points the way and common data systems keep all divisions communicating effectively."
[fhwa.dot.gov/ asset/ 10009/ tam_ topr806_ 3.cfm]
"Asset management, broadly defined, refers to any system that monitors and maintains things of value to an entity or group. It may apply to both tangible assets such as buildings and to intangible concepts such as intellectual property and goodwill. Asset management is a systematic process of operating, maintaining, upgrading, and disposing of assets cost-effectively. Alternative views of asset management in the engineering environment are: the practice of managing assets to achieve the greatest return (particularly useful for productive assets such as plant and equipment), and the process of monitoring and maintaining facilities systems, with the objective of providing the best possible service to users (appropriate for public infrastructure assets)." [Asset management. Wikipedia]
The circle-spoke diagram example "Leadership and data" was created using the ConceptDraw PRO diagramming and vector drawing software extended with the Circle-Spoke Diagrams solution from the area "What is a Diagram" of ConceptDraw Solution Park.
- Bubble diagrams with ConceptDraw PRO | Babble Diagram
- Bubble diagrams with ConceptDraw PRO | Concept maps with ...
- Bubble diagrams in Landscape Design with ConceptDraw PRO ...
- Venn diagrams with ConceptDraw PRO | Venn Diagrams | Fault ...
- How to Draw a Computer Network Diagrams | How To Draw a ...
- Data structure diagram with ConceptDraw PRO | Express-G ...
- Venn diagrams with ConceptDraw PRO | Venn Diagrams | Best ...
- Concept maps with ConceptDraw PRO | Bubble diagrams in ...
- Bubble diagrams in Landscape Design with ConceptDraw PRO ...
- Diagramming Software for Design UML Component Diagrams ...
- How To Create a Bubble Chart | Bubble diagrams in Landscape ...
- Data structure diagram with ConceptDraw PRO | Entity-Relationship ...
- Use Case Diagrams technology with ConceptDraw PRO | UML Use ...
- Brainstorming Diagrams
- Crea Diagramas De Flujo | Cross-Functional Flowchart (Swim Lanes ...
- How to Draw an Organization Chart | Organigrams with ...
- How to draw a Cross-Functional Flowchart | Cross-Functional ...
- UML Use Case Diagrams | Create Response Charts | Financial ...
- Polar Graph | Bubble diagrams in Landscape Design with ...
- How Does The Diagram Of An Illustration Of Transportation Look Like

