 Event-driven Process Chain Diagrams
Event-driven Process Chain (EPC) Diagram is a type of flowchart widely used for modeling in business engineering and reengineering, business process improvement, and analysis. EPC method was developed within the Architecture of Integrated Information Systems (ARIS) framework.
 Business Process Diagrams
Business Process Diagrams solution extends the ConceptDraw PRO BPM software with RapidDraw interface, templates, samples and numerous libraries based on the BPMN 1.2 and BPMN 2.0 standards, which give you the possibility to visualize equally easy simple and complex processes, to design business models, to quickly develop and document in details any business processes on the stages of project’s planning and implementation.
 Block Diagrams
Block diagrams solution extends ConceptDraw PRO software with templates, samples and libraries of vector stencils for drawing the block diagrams.
 Cross-Functional Flowcharts
Cross-functional flowcharts are powerful and useful tool for visualizing and analyzing complex business processes which requires involvement of multiple people, teams or even departments. They let clearly represent a sequence of the process steps, the order of operations, relationships between processes and responsible functional units (such as departments or positions).
HelpDesk
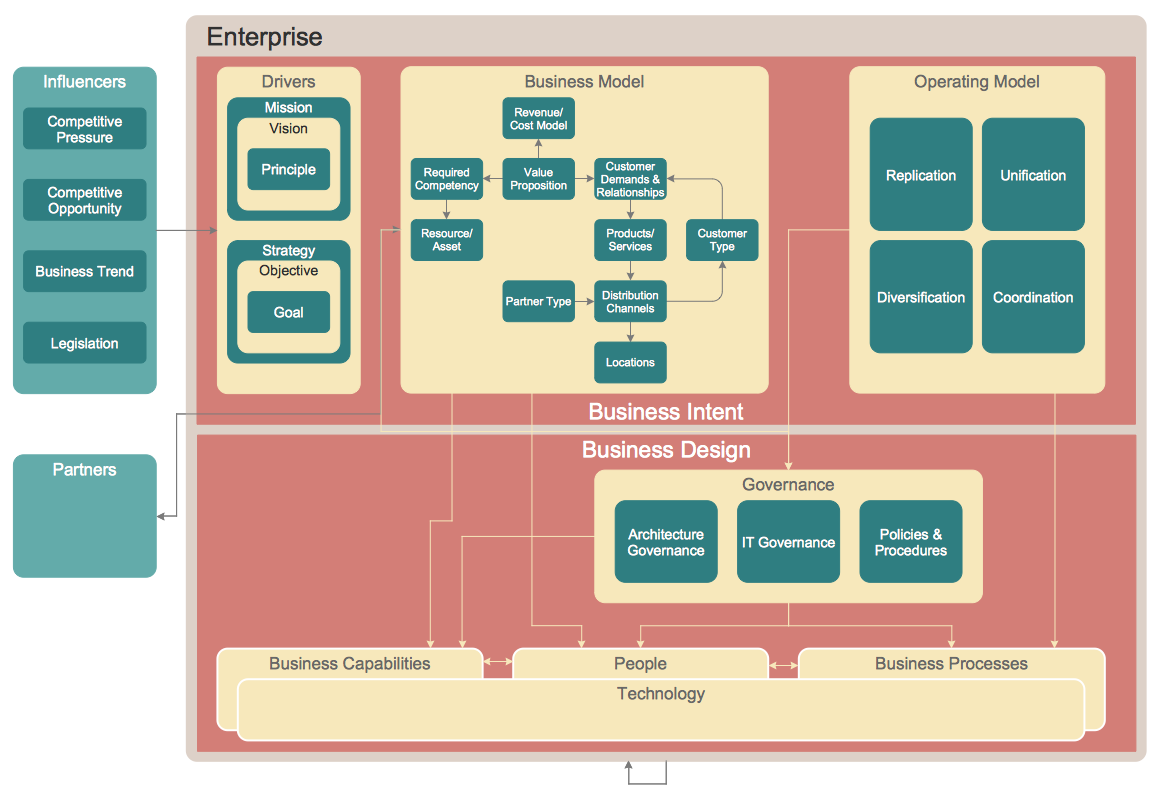
How to Create an Enterprise Architecture Diagram in ConceptDraw PRO
An Enterprise Architecture (EA) diagram is used to display the structure and operations of an organization.It is used to analyze and document an organization and its business functions, along with the applications and systems on which they are implemented. The aim of an enterprise architecture diagram is to determine how an organization can effectively achieve its current and future objectives. The Enterprise Architecture often uses diagrams to support the decision-making process. ConceptDraw PRO allows you to design Enterprise Architecture diagrams of any complexity.
 IDEF0 Diagrams
IDEF0 Diagrams visualize system models using the Integration Definition for Function Modeling (IDEF) methodology. Use them for analysis, development and integration of information and software systems, and business process modelling.
 Active Directory Diagrams
Active Directory Diagrams solution extends ConceptDraw PRO software with samples, templates and libraries of vector stencils for drawing the AD diagrams to visualize the detail structures of the Microsoft Windows networks.
- Architect Design Of Bubble Diagram Of Bank
- Bubble Diagram Of A Bank Architectual Design Project
- Bubble Diagram Banks
- Bubbles Diagram Design Architecture Bank
- Bubble Diagrams | Cisco Network Diagrams | How to Create a Bank ...
- Bubble Diagram For A Bank
- Bubble Diagram For Bank
- Example Of Bank Bubble Diagrams
- Bubble Flow Diagram Of Bank By Architecture
- Flow Chart Describing The Function Of Banks
- Buble Diagram Of Bank
- Function Of Bank With Digram
- Bubble Diagram Of A Community Bank
- Requirement In Plan Of Bank With Bubble Diagram
- Bubble And Line Diagram Of Bank Office
- Astronomy | Pyramid Diagrams | Bubble Diagrams | Hierarchy ...
- Express-G Diagram | How to Add a Bubble Diagram to a PowerPoint ...
- Functions Of Bank Flowchart
- Bank Building Design Concept Through Bubble Diagram
