HelpDesk
How to Create a Bar Chart

How to Create a Bar Chart

 Bar Graphs
The Bar Graphs solution enhances ConceptDraw DIAGRAM functionality with templates, numerous professional-looking samples, and a library of vector stencils for drawing different types of Bar Graphs, such as Simple Bar Graph, Double Bar Graph, Divided Bar Graph, Horizontal Bar Graph, Vertical Bar Graph, and Column Bar Chart.
How to Create a Line Chart

HelpDesk
How to Draw a Histogram

"A chart can take a large variety of forms, however there are common features that provide the chart with its ability to extract meaning from data.
Typically the data in a chart is represented graphically, since humans are generally able to infer meaning from pictures quicker than from text. Text is generally used only to annotate the data.
One of the more important uses of text in a graph is the title. A graph's title usually appears above the main graphic and provides a succinct description of what the data in the graph refers to.
Dimensions in the data are often displayed on axes. If a horizontal and a vertical axis are used, they are usually referred to as the x-axis and y-axis respectively. Each axis will have a scale, denoted by periodic graduations and usually accompanied by numerical or categorical indications. Each axis will typically also have a label displayed outside or beside it, briefly describing the dimension represented. If the scale is numerical, the label will often be suffixed with the unit of that scale in parentheses. ...
Within the graph a grid of lines may appear to aid in the visual alignment of data. The grid can be enhanced by visually emphasizing the lines at regular or significant graduations. The emphasized lines are then called major grid lines and the remainder are minor grid lines.
The data of a chart can appear in all manner of formats, and may include individual textual labels describing the datum associated with the indicated position in the chart. The data may appear as dots or shapes, connected or unconnected, and in any combination of colors and patterns. Inferences or points of interest can be overlaid directly on the graph to further aid information extraction.
When the data appearing in a chart contains multiple variables, the chart may include a legend (also known as a key). A legend contains a list of the variables appearing in the chart and an example of their appearance. This information allows the data from each variable to be identified in the chart." [Chart. Wikipedia]
The vector stencils library "Time series charts" contains 10 templates: 3 column charts, 3 bar charts, 2 line graphs and 2 dot plots. All these charts are Live Objects displaying the data from external data source files.
Use these chart templates to design your business performance digital dashboards using the ConceptDraw PRO diagramming and vector drawing software.
The example "Design elements - Time series charts" is included in the Time Series Dashboard solution from the area "What is a Dashboard" of ConceptDraw Solution Park.
Time series charts

How to Create a Pie Chart

Bar Diagrams for Problem Solving. Create event management bar charts with Bar Graphs Solution

HelpDesk
How to Create Data-Driven Infographics

 Infographics Area
Solutions of the area What is Infographics from ConceptDraw Solution Park collect templates, samples and vector stencils libraries with design elements for the drawing information graphics.
Pyramid Diagram and Pyramid Chart

 Area Charts
Area Charts are used to display the cumulative totals over time using numbers or percentages; or to show trends over time among related attributes. The Area Chart is effective when comparing two or more quantities. Each series of data is typically represented with a different color, the use of color transparency in an object’s transparency shows overlapped areas and smaller areas hidden behind larger areas.
 Histograms
How to make a Histogram? Making a Histogram is an incredibly easy process when it is done with ConceptDraw DIAGRAM. The Histograms Solution enhances ConceptDraw DIAGRAM functionality with extensive drawing tools, numerous samples, and examples; also a quick-start template and library of ready vector stencils for visualization the data and professional drawing Histograms.
 Pie Charts
Pie Charts are extensively used in statistics and business for explaining data and work results, in mass media for comparison (i.e. to visualize the percentage for the parts of one total), and in many other fields. The Pie Charts solution for ConceptDraw DIAGRAM offers powerful drawing tools, varied templates, samples, and a library of vector stencils for simple construction and design of Pie Charts, Donut Chart, and Pie Graph Worksheets.
 Football
The Football Solution extends ConceptDraw DIAGRAM.5 (or later) software with samples, templates, and libraries of vector objects for drawing football (American) diagrams, plays schemas, and illustrations. It can be used to make professional looking documen
 Metro Map
Metro Map solution extends ConceptDraw DIAGRAM software with templates, samples and library of vector stencils for drawing the metro maps, route maps, bus and other transport schemes, or design tube-style infographics.
 Chemical and Process Engineering
This chemical engineering solution extends ConceptDraw DIAGRAM.9.5 (or later) with process flow diagram symbols, samples, process diagrams templates and libraries of design elements for creating process and instrumentation diagrams, block flow diagrams (BFD
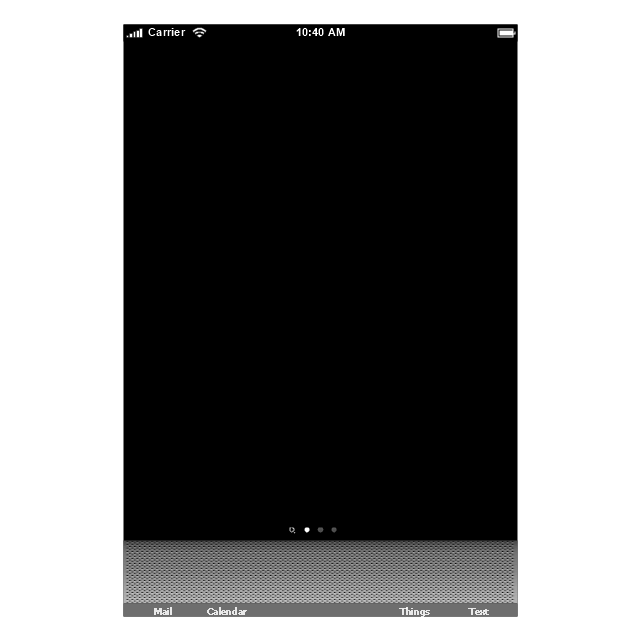
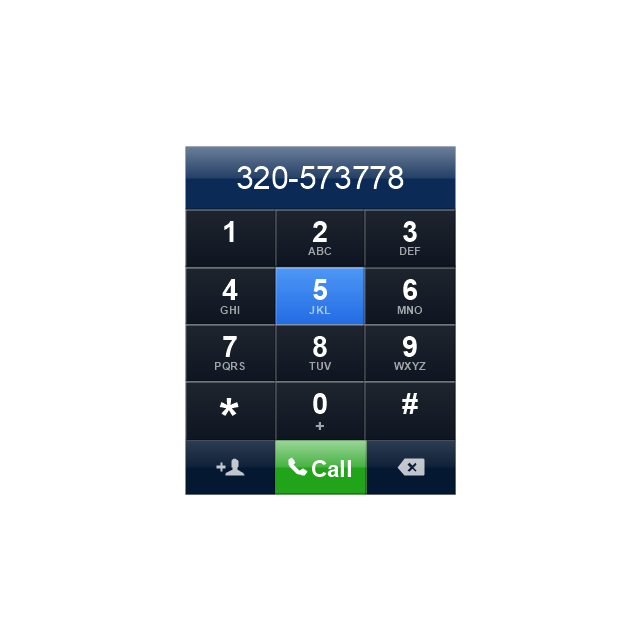
The vector stencils library "iPhone interface" contains 119 iPhone UI design elements.
Use it for development of graphic user interface (GUI) for iPhone software applications in the ConceptDraw PRO diagramming and vector drawing software extended with the Graphic User Interface solution from the Software Development area of ConceptDraw Solution Park.
Use it for development of graphic user interface (GUI) for iPhone software applications in the ConceptDraw PRO diagramming and vector drawing software extended with the Graphic User Interface solution from the Software Development area of ConceptDraw Solution Park.
iPhone case

iPhone case, horizontal

Display
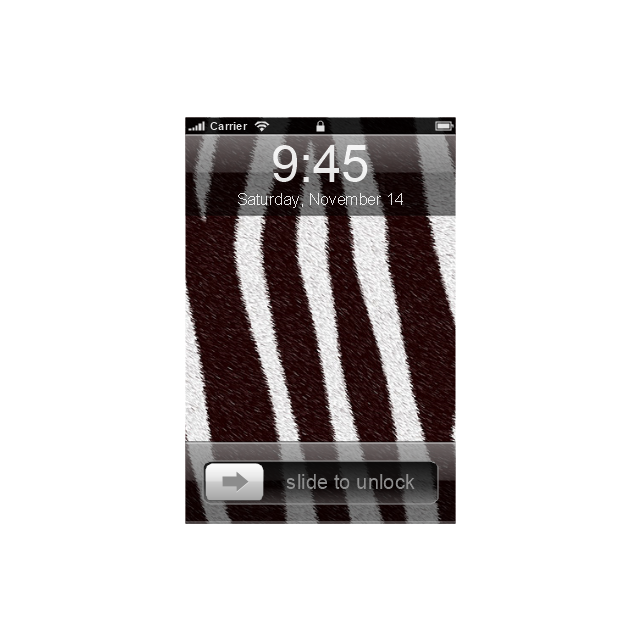
Screen

Home screen
Keypad control
Status bar
Navigation bar

Navigation bar with buttons

Navigation bar with controls
Navigation bar with controls
Navigation bar with buttons, horizontal
Navigation bar with controls, horizontal
Modal view
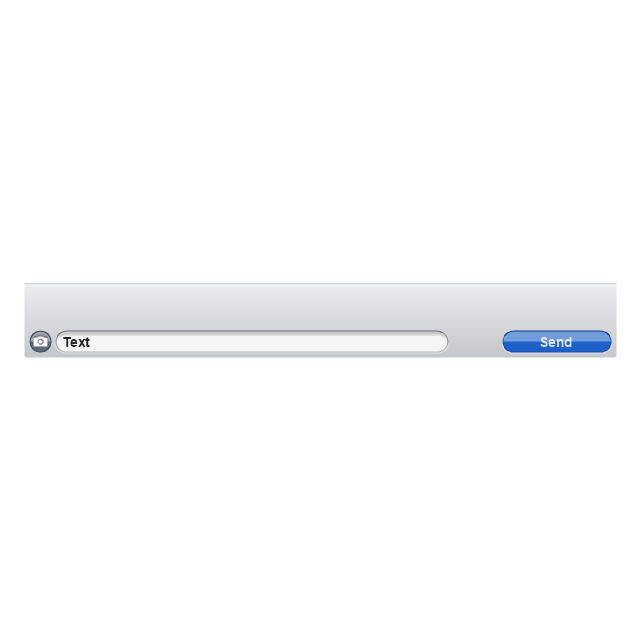
Search bar
Text field 1

Text field 2

Text field, varying

Table row

Table view row
Table view (simple list)
-iphone-interface---vector-stencils-library.png--diagram-flowchart-example.png)
Table view (with header)
-iphone-interface---vector-stencils-library.png--diagram-flowchart-example.png)
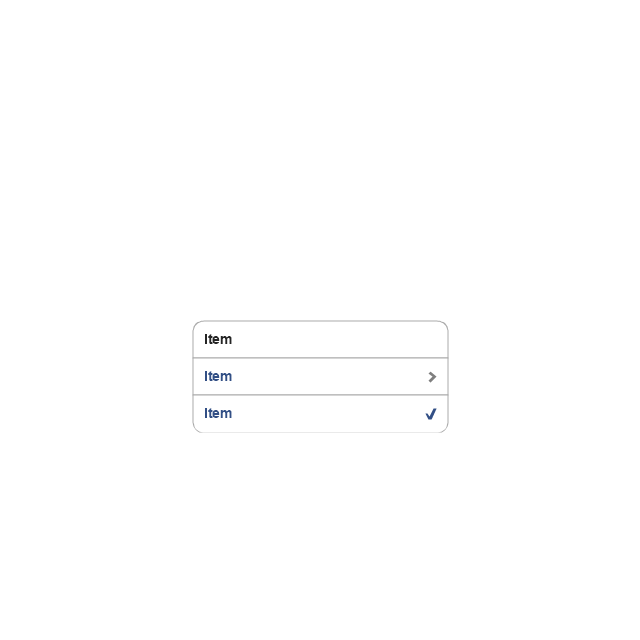
Action list
Control button

Navigational control button

Add button

Navigation toolbar

Tab bar

Action sheet

Choice button

Rounded rectangle button

Keyboard control
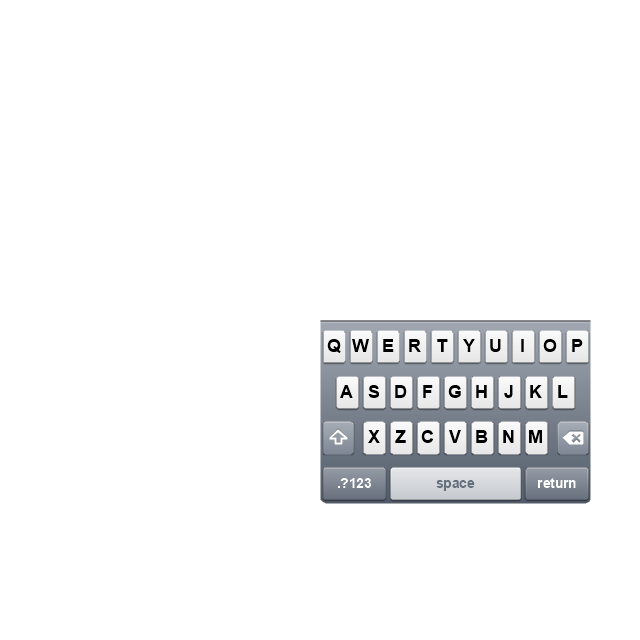
Keyboard literal button
Keyboard button, pressed
Keyboard label button

Selection frame 1

Selection frame 2

Loupe

Message box 1
Message box 2
Progress view

Progress view

Progress view

Player control
Label button

Back button

Forward button

Option button
Checkbox

Radio button

Alert
Two-button alert
Two-button alert (v 3.0)
-iphone-interface---vector-stencils-library.png--diagram-flowchart-example.png)
Up-Down control

Segmented control

Segmented control

Segmented control
Segmented control
Pop-up menu button

Popup menu

Clock, white

Clock, black

Clock application table

Date and time picker (1/2 parts)
-iphone-interface---vector-stencils-library.png--diagram-flowchart-example.png)
Date and time picker (3 parts)
-iphone-interface---vector-stencils-library.png--diagram-flowchart-example.png)
Date and time picker (4 parts)
-iphone-interface---vector-stencils-library.png--diagram-flowchart-example.png)
Date and time picker (v 3.0)
-iphone-interface---vector-stencils-library.png--diagram-flowchart-example.png)
Switch control

System button

Reply button

Organize button

Remove button

Refresh button

Play button

FastForward button

Pause button

Rewind button

Backward icon
Forward icon
Share button

Camera button

Compose button

Bookmarks button

Search button

Add button

Trash button

Bookmarks tab icon
Contacts tab icon
Downloads tab icon
Favorites tab icon
Featured tab icon
History tab icon
MostRecent tab icon
MostViewed tab icon
Search tab icon
More tab icon
SMS tab icon
Mail tab icon
Charts tab icon
World clock tab icon
Alarm tab icon
Stopwatch tab icon
Timer tab icon
Badge
Delete button control

Checkmark

Delete button

Insert

Disclosure indicator

Clear button

Bookmarks badge
Badge with varying width 1
Badge with varying width 2
Badge with varying width 3
Activity indicator

Network activity indicator

Page control

Search badge
Slider

 Baseball
The Baseball Solution extends ConceptDraw DIAGRAM.5 (or later) software with samples, templates, and libraries of vector objects for drawing baseball diagrams, plays, and illustrations. It can be used to make professional looking documents, presentations,
- Composition Dashboard | Chart Examples | Pie Chart Software ...
- Bar Chart Software | Design elements - Bar Charts | Column Chart ...
- Column Chart Template
- Column Chart Software | Column Chart Examples | How to Create a ...
- Design elements - Time series charts | Design elements ...
- Design elements - Comparison charts and indicators | Design ...
- Line graphs - Vector stencils library | Graphs and Charts Area ...
- 3D pictorial street map | The 100th Tour de France - Route map | 2D ...
- ConceptDraw Arrows10 Technology | Vertical Cross Functional ...
- Chart Templates | Donut Chart Templates | Line Chart Templates ...
- Winter Sports | Winter Sports Vector Clipart. Medal Map . Spatial ...
- Line Chart Templates
- Line Graphs | Line Graph Charting Software | Line Chart Template
- Line Chart Template for Word | How to Create a Line Chart | Line ...
- Line Graphs | Line Graph Charting Software | Line graph template ...
- Picture graph template | Picture graph - Population growth by ...
- Gestures - Vector stencils library
- Circular arrows diagram
- Multilevel pyramid diagram template | Triangular pyramid diagram ...
- Timeline template | Management | Business Processes | Time Line ...