Sales Growth. Bar Graphs Example
This sample was created in ConceptDraw PRO diagramming and vector drawing software using the Bar Graphs Solution from Graphs and Charts area of ConceptDraw Solution Park. It is Bar Graphs example, Sales Growth example, Column Chart Example - Sales Report.Bar Diagrams for Problem Solving. Create event management bar charts with Bar Graphs Solution
Create bar charts for event management problem solving and visual data comparison using the ConceptDraw PRO diagramming and vector drawing software extended with the Bar Graphs Solution from the Graphs and Charts area of ConceptDraw Solition Park.Bar Chart Examples
Complete set of bar chart examples is produced using ConceptDraw software. Surfing bar chart examples you can find an example that is the best for your case.Column Chart Software
ConceptDraw Column Chart software allows drawing column charts using predesigned objects or drawing tools. In ConceptDraw Column Chart software you can find a complete set of column chart tools and objects.Bar Diagrams for Problem Solving. Create business management bar charts with Bar Graphs Solution
Create bar charts for business management problem solving and data comparison using the ConceptDraw PRO diagramming and vector drawing software extended with the Bar Graphs Solution from the Graphs and Charts area of ConceptDraw Solition Park.Bar Chart Template for Word
All these bar chart templates are included in the Bar Graphs solution.You can quickly rework these bar graph templates into your own charts by simply changing displayed data, title and legend texts.
Chart Maker for Presentations
Easy charting software comes with beautiful chart templates and examples. This makes it easy to create professional charts without prior experience.Basic Diagramming
Create flowcharts, organizational charts, bar charts, line graphs, and more with ConceptDraw PRO.
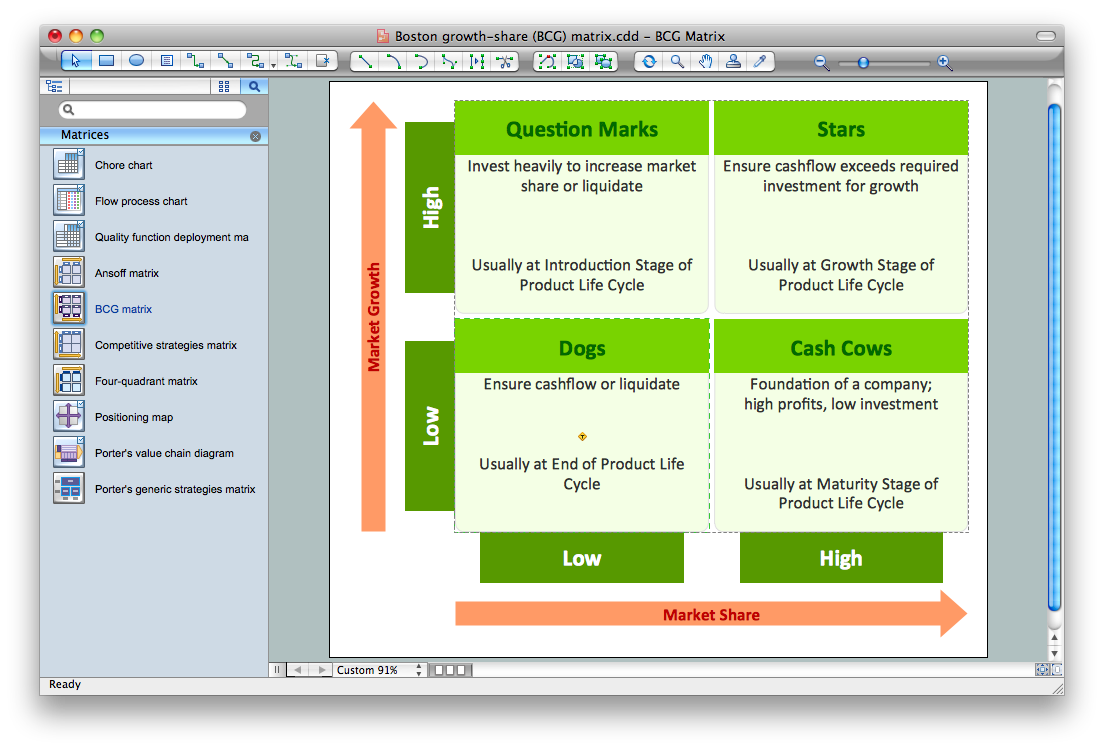
Growth-Share Matrix Software
Growth-Share Matrix Software - ConceptDraw PRO is a powerful diagramming and vector drawing software for creating professional looking Growth–Share Matrices. For simple and quick creating the Growth–Share Matrix ConceptDraw PRO offers the Matrices Solution from the Marketing Area of ConceptDraw Solution Park.The Matrices Solution also provides a wide variety of templates and samples that will help you to create the Matrix diagrams of any difficulty.
Create Graphs and Charts
Charting Software allows you to create diagrams, charts, graphs, flowcharts, and other business graphics. ConceptDraw PRO include simple shape drawing tools, examples, templates, and symbol libraries.Line Chart Template for Word
This sample was created in ConceptDraw PRO diagramming and vector drawing software using the Line Graphs Solution from Graphs and Charts area of ConceptDraw Solution Park.This sample shows the Line Chart of annual percentage change. The Line Chart allows you to clearly see the changes of data over the time.
Polar Graph
This sample shows the Polar Graph. The Polar Graph is a graph in the polar coordinate system in which the each point on the plane is defined by two values - the polar angle and the polar radius. The certain equations have very complex graphs in the Cartesian coordinates, but the application of the polar coordinate system allows usually produce the simple Polar Graphs for these equations.TQM Diagram Tool
The Total Quality Management Diagram solution helps you and your organization visualize business and industrial processes. Create Total Quality Management diagrams for business process with ConceptDraw software.Bar Diagrams for Problem Solving. Create manufacturing and economics bar charts with Bar Graphs Solution
Create bar charts for visualizing problem solving in manufacturing and economics using the ConceptDraw PRO diagramming and vector drawing software extended with the Bar Graphs Solution from the Graphs and Charts area of ConceptDraw Solition Park.Pyramid Diagram
ConceptDraw Pyramid Diagram software allows drawing column charts using predesigned objects or drawing tools.- Bar Graphs | Sales Growth . Bar Graphs Example | Bar Graph | Bar ...
- Sales Growth . Bar Graphs Example | Bar Chart Examples | Financial ...
- Sales Growth . Bar Graphs Example | Bar Diagrams for Problem ...
- Chart Maker for Presentations | Sales Growth . Bar Graphs Example ...
- Sales Growth . Bar Graphs Example | Sales Flowcharts ...
- Sales Growth . Bar Graphs Example | Sales KPIs and Metrics - Vector ...
- Sales Growth . Bar Graphs Example | Rainfall Bar Chart | Bar Charts ...
- Sales Growth . Bar Graphs Example | Bar Diagrams for Problem ...
- Sales Growth . Bar Graphs Example | Pictures of Graphs | Picture ...
- Bar Graphs | Sales Growth . Bar Graphs Example | Bar Graph | A ...
- How to Create a Picture Graph in ConceptDraw PRO | Picture ...
- Sales Growth . Bar Graphs Example | Basic Diagramming | Bar Chart ...
- Sales Growth . Bar Graphs Example | Bar Chart Template for Word ...
- Double bar graph - Template | Sales Growth . Bar Graphs Example ...
- Bar Chart Examples | Bar Chart Template for Word | Rainfall Bar ...
- Basic Diagramming | Sales Growth . Bar Graphs Example | Pictures ...
- Bar Chart Template for Word | Sales Growth . Bar Graphs Example ...
- Picture Graphs | Picture Graph | How to Create a Picture Graph in ...
- Column Chart Template
- Image chart - The total financing of the Philippines from 2001-2010 ...


