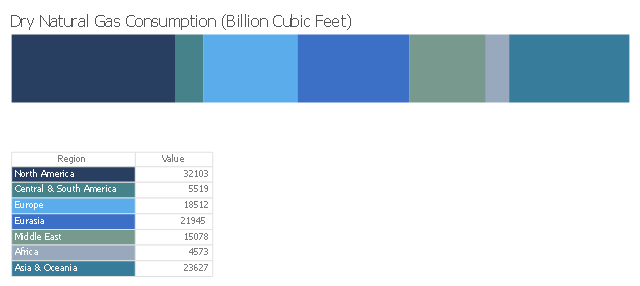
This divided bar diagram sample shows the global natural gas consumption by regions in 2013. It was designed using data of the International Energy Statistics webpage from the U.S. Energy Information Administration (EIA) website. [eia.gov/ cfapps/ ipdbproject/ IEDIndex3.cfm?tid=3&pid=26&aid=2]
"Natural gas is a fossil fuel formed when layers of buried plants and animals are exposed to intense heat and pressure over thousands of years. The energy that the plants originally obtained from the sun is stored in the form of chemical bonds in natural gas. Natural gas is a nonrenewable resource because it cannot be replenished on a human time frame. Natural gas is a hydrocarbon gas mixture consisting primarily of methane, but commonly includes varying amounts of other higher alkanes and even a lesser percentage of carbon dioxide, nitrogen, and hydrogen sulfide. Natural gas is an energy source often used for heating, cooking, and electricity generation. It is also used as fuel for vehicles and as a chemical feedstock in the manufacture of plastics and other commercially important organic chemicals." [Natural gas. Wikipedia]
The chart example "Global natural gas consumption" was created using ConceptDraw PRO diagramming and vector drawing software extended with the Divided Bar Diagrams solution from the Graphs and Charts area of ConceptDraw Solution Park.
 Manufacturing and Maintenance
Manufacturing and maintenance solution extends ConceptDraw PRO software with illustration samples, templates and vector stencils libraries with clip art of packaging systems, industrial vehicles, tools, resources and energy.
- What Are Non Renewable Resources Examples
- Non Renewable Resources Piechart Or Graph Diagram
- Flowchart Enable Or Nonrenewable Resource
- Diagram Of Renewable And Nonrenewable Resources
- Manufacturing and Maintenance | Diagram Of Non Renewable ...
- Manufacturing and Maintenance | Energy resources diagram | Active ...
- Manufacturing and Maintenance | Energy resources diagram ...
- Manufacturing and Maintenance | Divided bar graph - Global natural ...
- Manufacturing and Maintenance | Renewable And Non Renewable ...
- Divided Bar Diagrams | Basic Diagramming | Design elements ...
- Sales Growth. Bar Graphs Example | Bar Graph | Divided Bar ...
- Manufacturing and Maintenance | Clipart Nonrenewable Resources
- Divided Bar Diagrams | How to Draw a Divided Bar Chart in ...
- How to Draw a Divided Bar Chart in ConceptDraw PRO | Divided ...
- Manufacturing and Maintenance | Renewable And Nonrenewable ...
- Global natural gas consumption (2010) - Divided bar graph | Bar ...
- Sales Growth. Bar Graphs Example | Double bar graph - Template ...
- Divided Bar Diagrams | Basic Diagramming | Global natural gas ...
- Divided Bar Diagrams
- Natural gas condensate - PFD | Resources and energy - Vector ...
