 Sales Dashboard
Sales Dashboard solution extends ConceptDraw PRO software with templates, samples and library of vector stencils for drawing the visual dashboards of sale metrics and key performance indicators (KPI).
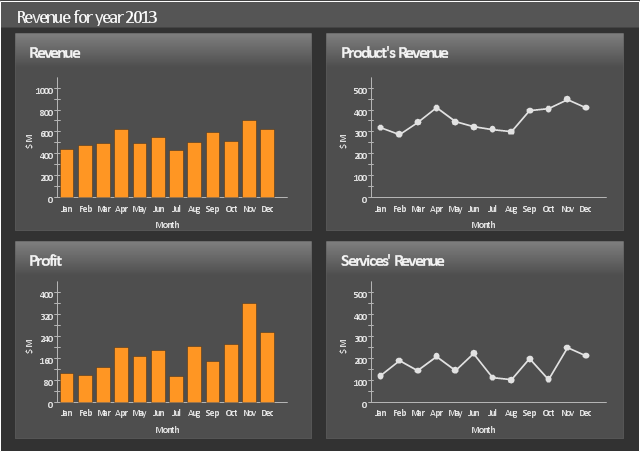
This sales dashboard sample shows how key performance parameters such as revenue, profit, product's revenue and product's profit change in time using bar charts and line graphs.
The dashboard example "Sales revenue" was created using the ConceptDraw PRO diagramming and vector drawing software extended with the Sales Dashboard solution from the Marketing area of ConceptDraw Solution Park.
The dashboard example "Sales revenue" was created using the ConceptDraw PRO diagramming and vector drawing software extended with the Sales Dashboard solution from the Marketing area of ConceptDraw Solution Park.
Sales dashboard
 Sales Dashboard
Sales Dashboard solution extends ConceptDraw PRO software with templates, samples and library of vector stencils for drawing the visual dashboards of sale metrics and key performance indicators (KPI).
 Business Process Diagrams
Business Process Diagrams solution extends the ConceptDraw PRO BPM software with RapidDraw interface, templates, samples and numerous libraries based on the BPMN 1.2 and BPMN 2.0 standards, which give you the possibility to visualize equally easy simple and complex processes, to design business models, to quickly develop and document in details any business processes on the stages of project’s planning and implementation.
- Sales Growth. Bar Graphs Example | Bar Chart Examples | Column ...
- Sales Dashboard | | | Dashboard Sales Profit
- Sales Growth. Bar Graphs Example | Sales Dashboards for Your ...
- Waterfall Bar Chart | How to Purchase ConceptDraw Products for ...
- Sales Charts
- Bar Diagram Math | Management Consultant | Landscape ...
- Feature Comparison Chart Software | Block diagram - Porter's five ...
- Bar Diagrams for Problem Solving. Create event management bar ...
- Marketing and Sales Organization chart . Organization chart ...
- Sales Process Flowchart. Flowchart Examples | Root cause analysis ...
- Dashboard | What is a KPI? | How to Create a Sales Dashboard ...
- Waterfall Bar Chart | Process Flowchart | How to Create a Bar Chart ...
- Line Chart Template for Word | Picture graph - Template | Scatter ...
- Performance Indicators | Sales Dashboard | Constant improvement ...
- Sales
- Organization chart - Foodbank | Organizational Charts | Horizontal ...
- Process Flowchart | Block diagram - Porter's five forces model | Bar ...
- Sales Technique Diagram
- Bar Diagram Math | Process Diagrams | Percentage Pie Chart. Pie ...
- Target and Circular Diagrams | How to Create a Sales Flowchart ...