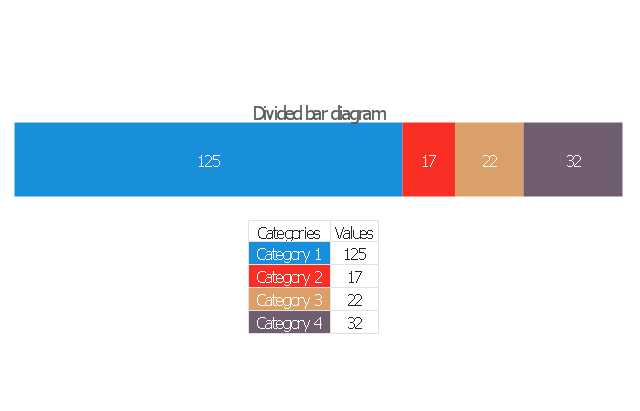
The vector stencils library "Divided bar diagrams" contains 12 templates of divided bar diagrams for visualizing percent composition of one total consists of few components.
Drag the template from the library to your document and enter your data.
Use these shapes to draw your divided bar diagrams in the ConceptDraw PRO diagramming and vector drawing software.
The vector stencils library "Divided bar diagrams" is included in the Divided Bar Diagrams solution from the Graphs and Charts area of ConceptDraw Solution Park.
Bar Diagram Math
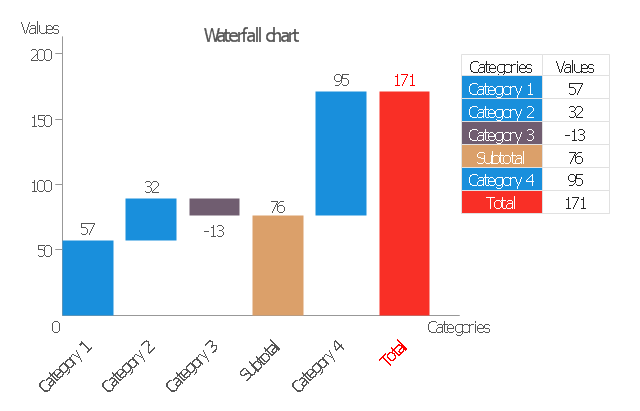
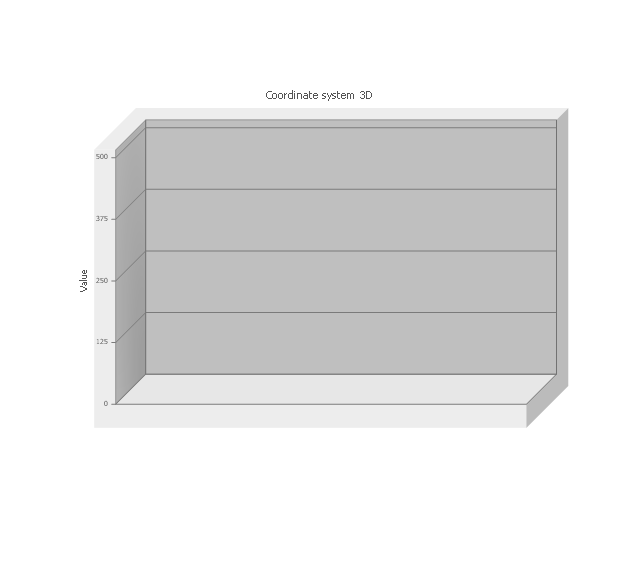
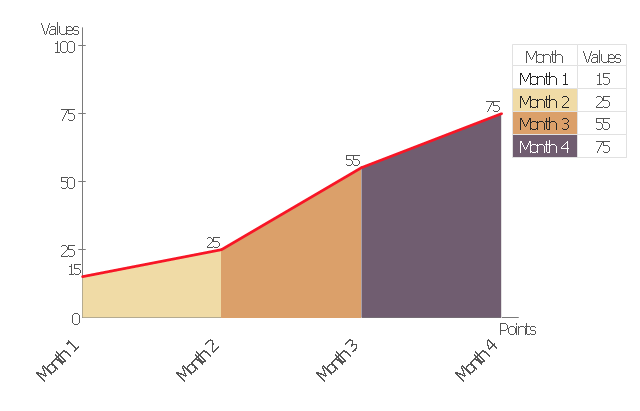
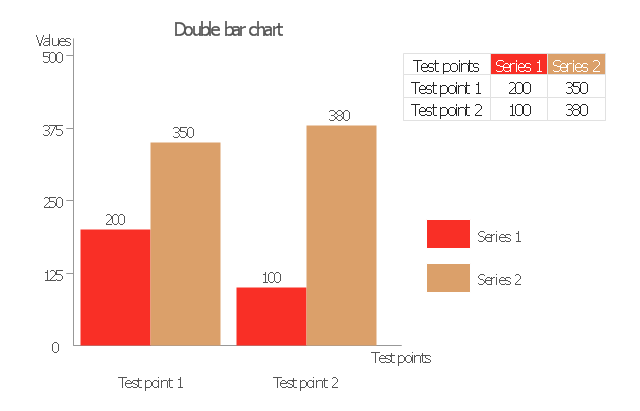
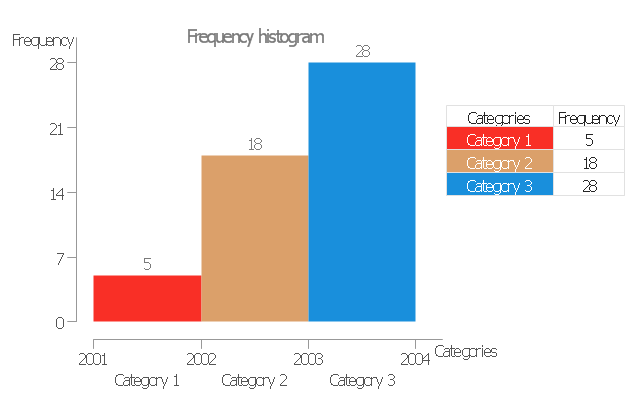
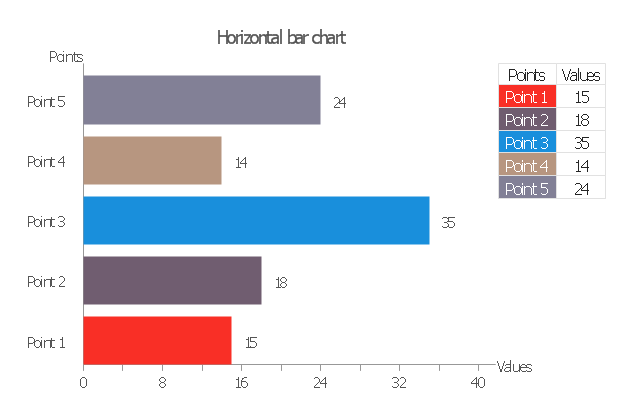
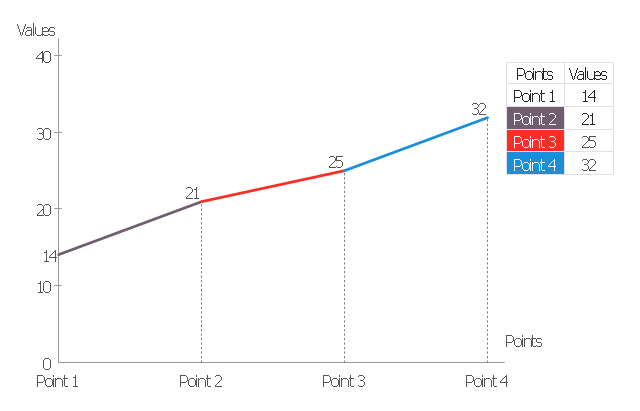
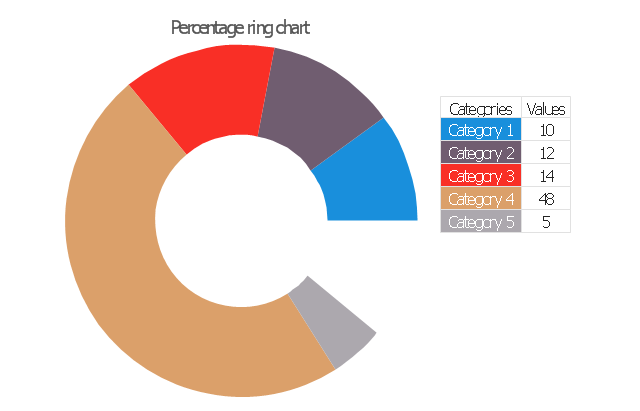
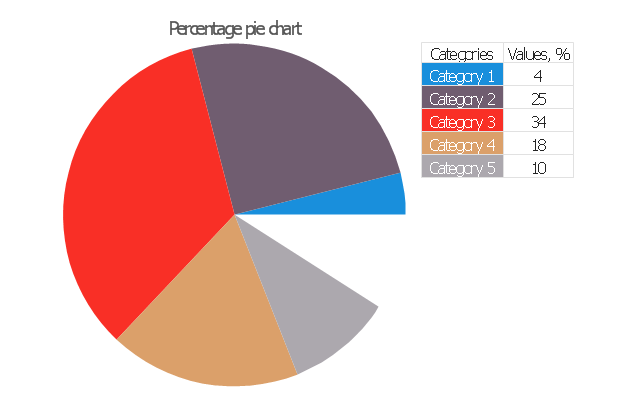
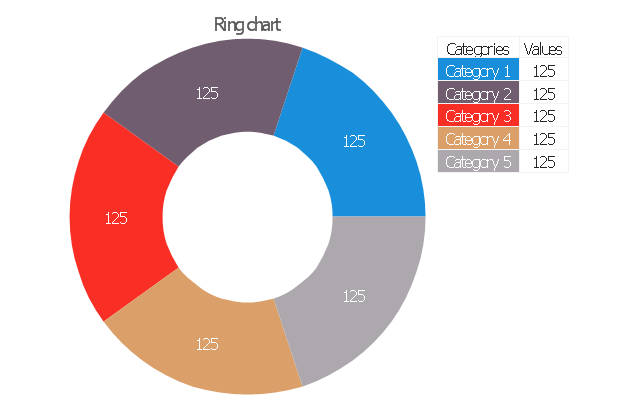
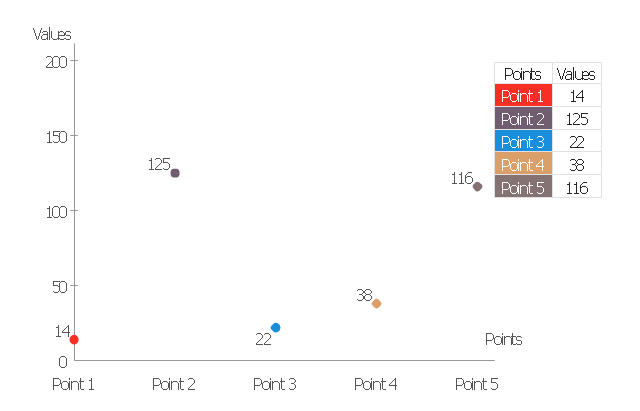
ConceptDraw PRO extended with Divided Bar Diagrams solution from Graphs and Charts area of ConceptDraw Solution Park is the best software for quick and simple drawing the Divided Bar Diagrams and Bar Diagram Math.The vector stencils library "Data-driven charts" contains 13 data-driven graphs and charts: area chart, divided bar diagram, double bar graph, frequency histogram, horizontal bar chart, line graph, percentage ring chart, percentage pie chart, scatter plot, column chart, waterfall chart.
Use it to visualize quantitative data in your data-driven infographics.
The graphs example "Data-driven charts - Vector stencils library" was created using the ConceptDraw PRO diagramming and vector graphics software extended with the Data-driven Infographics solution from the area "What is infographics" of ConceptDraw Solution Park.
Bar Charts
ConceptDraw PRO diagramming and vector drawing software extended with Bar Graphs solution from the Graphs and Charts area of ConceptDraw Solution Park is ideal for drawing the Bar Charts fast and simply.Sales Growth. Bar Graphs Example
This sample was created in ConceptDraw PRO diagramming and vector drawing software using the Bar Graphs Solution from Graphs and Charts area of ConceptDraw Solution Park. It is Bar Graphs example, Sales Growth example, Column Chart Example - Sales Report.Bar Graph
You need to draw the Bar Graph? The automated tool can be useful for you. ConceptDraw PRO diagramming and vector drawing software extended with Bar Graphs solution from Graphs and Charts area of ConceptDraw Solution Park will help you create any Bar Graph.Bar Diagrams for Problem Solving. Create economics and financial bar charts with Bar Graphs Solution
Create bar graphs for visualizing economics problem solving and financial data comparison using the ConceptDraw PRO diagramming and vector drawing software extended with the Bar Graphs Solution from the Graphs and Charts area of ConceptDraw Solition Park.Bar Diagrams for Problem Solving. Create business management bar charts with Bar Graphs Solution
Create bar charts for business management problem solving and data comparison using the ConceptDraw PRO diagramming and vector drawing software extended with the Bar Graphs Solution from the Graphs and Charts area of ConceptDraw Solition Park.Bar Diagrams for Problem Solving. Create space science bar charts with Bar Graphs Solution
Bar charts represent data in different categories or groups. Create bar graphs for visual solving your scientific problems and data comparison using the ConceptDraw PRO diagramming and vector drawing software extended with the Bar Graphs Solution from the Graphs and Charts area of ConceptDraw Solition Park.Bar Diagrams for Problem Solving. Create manufacturing and economics bar charts with Bar Graphs Solution
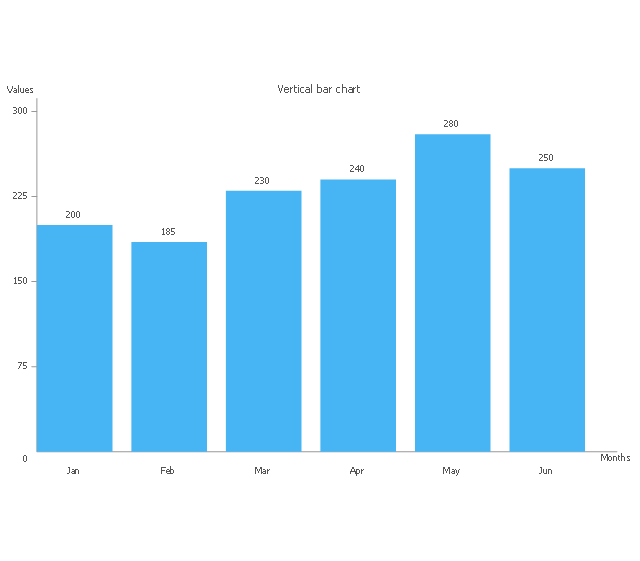
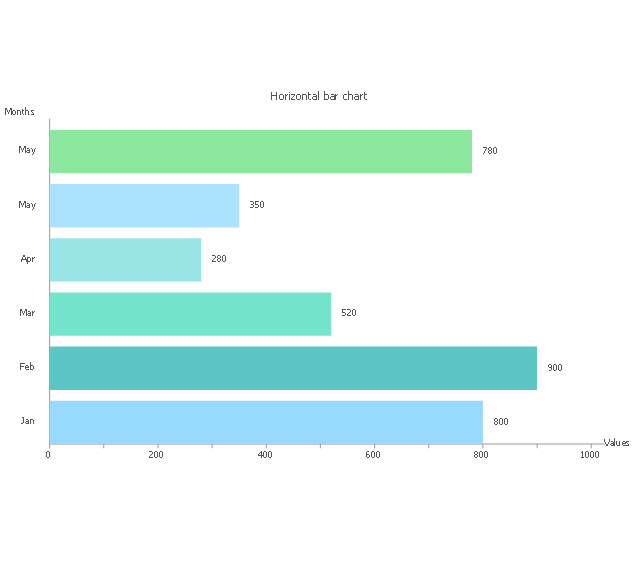
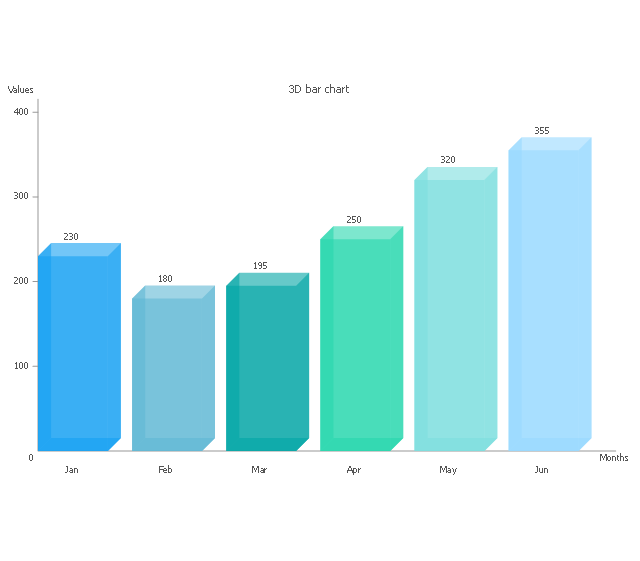
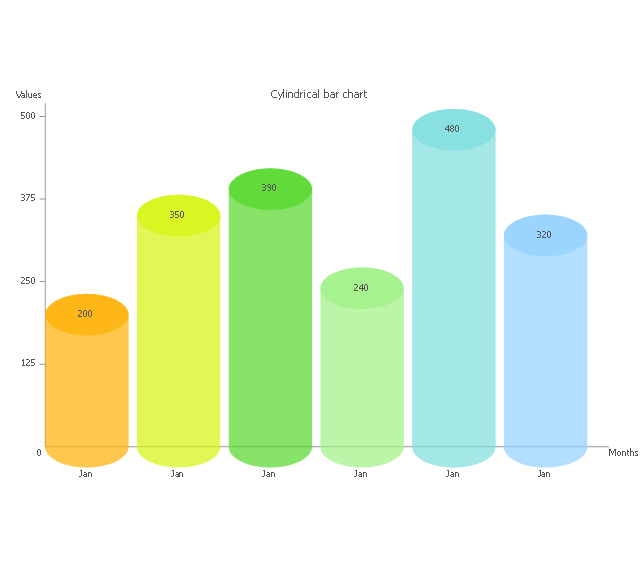
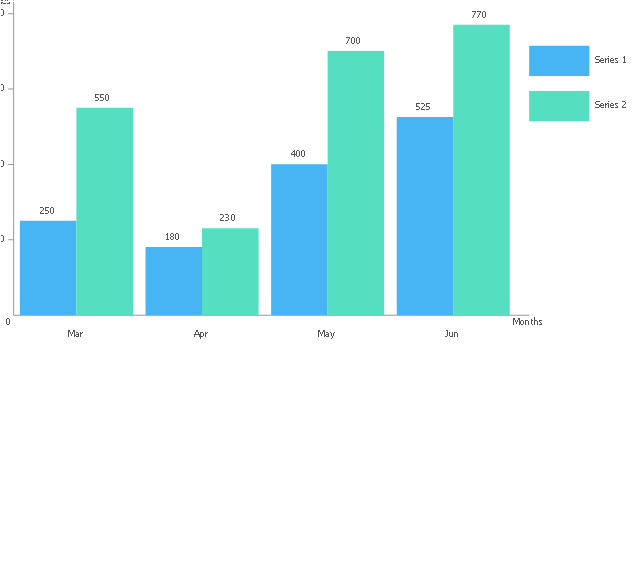
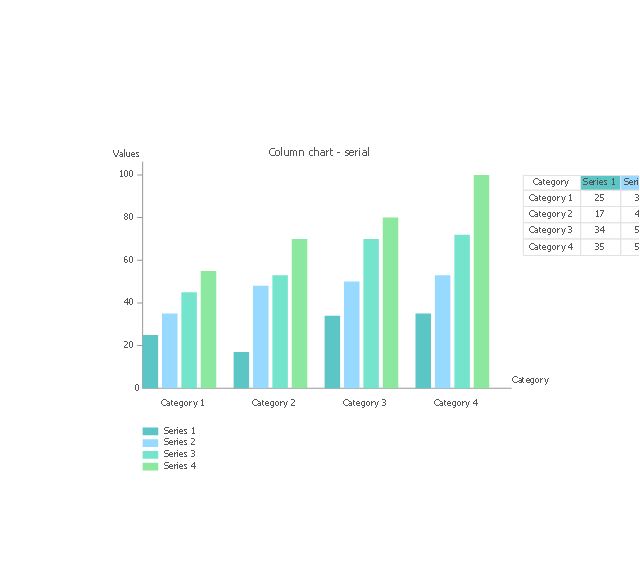
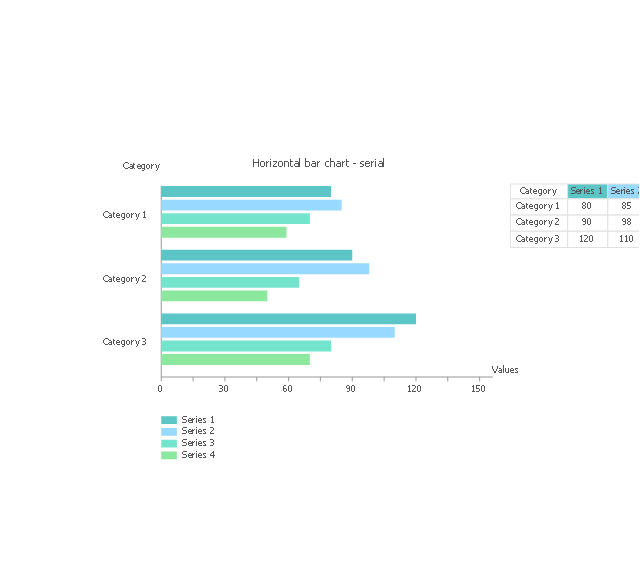
Create bar charts for visualizing problem solving in manufacturing and economics using the ConceptDraw PRO diagramming and vector drawing software extended with the Bar Graphs Solution from the Graphs and Charts area of ConceptDraw Solition Park.The vector stencils library "Bar charts" contains 7 templates of bar and column charts for visualizing quantitative and statistical data comparison and changes in time series. Drag template from library to your document and enter your data.
Use these shapes to draw your bar graphs in the ConceptDraw PRO diagramming and vector drawing software.
The vector stencils library "Bar charts" is included in the Bar Graphs solution from the Graphs and Charts area of ConceptDraw Solution Park.
Use these shapes to draw your bar graphs in the ConceptDraw PRO diagramming and vector drawing software.
The vector stencils library "Bar charts" is included in the Bar Graphs solution from the Graphs and Charts area of ConceptDraw Solution Park.
Rainfall Bar Chart
This sample shows the Horizontal Bar Chart of the average monthly rainfalls. This sample was created in ConceptDraw PRO diagramming and vector drawing software using the Bar Graphs Solution from the Graphs and Charts area of ConceptDraw Solution Park.Bar Diagrams for Problem Solving. Create event management bar charts with Bar Graphs Solution
Create bar charts for event management problem solving and visual data comparison using the ConceptDraw PRO diagramming and vector drawing software extended with the Bar Graphs Solution from the Graphs and Charts area of ConceptDraw Solition Park.Bar Chart
ConceptDraw PRO extended with Bar Graphs solution from Graphs and Charts area of ConceptDraw Solution Park is ideal software for quick and simple drawing bar chart of any complexity graph.
 Divided Bar Diagrams
The Divided Bar Diagrams Solution extends the capabilities of ConceptDraw PRO v10 with templates, samples, and a library of vector stencils for drawing high impact and professional Divided Bar Diagrams and Graphs, Bar Diagram Math, and Stacked Graph.
- Divided Bar Diagrams
- Bar Graph On Food
- Divided bar diagrams - Vector stencils library | Bar Diagram Math ...
- Divided bar diagrams - Vector stencils library
- Divided bar diagram
- Time series charts - Vector stencils library | Bar Diagrams for ...
- Bar Graph | Picture graphs - Vector stencils library | Sales Growth ...
- Education charts - Vector stencils library | Mathematical Diagrams ...
- Bar Diagrams for Problem Solving. Create space science bar charts ...
- Picture graphs - Vector stencils library | Bar Diagrams for Problem ...
- Bar Diagram Math | Bar Chart Examples | Bar Diagrams for Problem ...
- Design elements - Picture bar graphs | Picture graphs - Vector ...
- Bar Chart Software | Column Chart Software | Bar charts - Vector ...
- Data-driven charts - Vector stencils library | Bar charts - Vector ...
- 3 Bar Diagram
- Bar Diagram Math | Picture Graphs | Nature | An Bar Graph On ...
- Bar Diagrams for Problem Solving. Create manufacturing and ...
- Bar Diagrams for Problem Solving. Create economics and financial ...
- Bar Chart Examples | How to Create a Bar Chart | Bar charts - Vector ...
- Sales Growth. Bar Graphs Example | Bar Diagrams for Problem ...
-divided-bar-diagrams---vector-stencils-library.png--diagram-flowchart-example.png)
-2-divided-bar-diagrams---vector-stencils-library.png--diagram-flowchart-example.png)
-divided-bar-diagrams---vector-stencils-library.png--diagram-flowchart-example.png)
-2-divided-bar-diagrams---vector-stencils-library.png--diagram-flowchart-example.png)
-divided-bar-diagrams---vector-stencils-library.png--diagram-flowchart-example.png)
-2-divided-bar-diagrams---vector-stencils-library.png--diagram-flowchart-example.png)
-divided-bar-diagrams---vector-stencils-library.png--diagram-flowchart-example.png)
-2-divided-bar-diagrams---vector-stencils-library.png--diagram-flowchart-example.png)
-divided-bar-diagrams---vector-stencils-library.png--diagram-flowchart-example.png)
-2-divided-bar-diagrams---vector-stencils-library.png--diagram-flowchart-example.png)
-divided-bar-diagrams---vector-stencils-library.png--diagram-flowchart-example.png)
-2-divided-bar-diagrams---vector-stencils-library.png--diagram-flowchart-example.png)


-data-driven-charts---vector-stencils-library.png--diagram-flowchart-example.png)
