Pictures of Graphs
ConceptDraw PRO diagramming and vector drawing software extended with Picture Graphs solution from the Graphs and Charts Area is the best choice for making professional looking pictures of graphs and colorful picture graphs.Picture Graph
A Picture Graph is a popular and widely used type of a bar graph, which represents data in various categories using the pictures. ConceptDraw PRO extended with Picture Graphs solution from the Graphs and Charts area of ConceptDraw Solution Park is the best software for fast and simple drawing professional looking Picture Graphs.Basic Diagramming
Create flowcharts, organizational charts, bar charts, line graphs, and more with ConceptDraw PRO.
Line Chart Examples
The Line Graphs solution from Graphs and Charts area of ConceptDraw Solution Park contains a set of examples, templates and design elements library of line and scatter charts. Use it to draw line and scatter graphs using ConceptDraw PRO diagramming and vector drawing software for illustrating your documents, presentations and websites.
 Picture Graphs
Typically, a Picture Graph has very broad usage. They many times used successfully in marketing, management, and manufacturing. The Picture Graphs Solution extends the capabilities of ConceptDraw PRO v10 with templates, samples, and a library of professionally developed vector stencils for designing Picture Graphs.
What Is a Line Chart
What Is a Line Chart? A line chart is a basic type of chart represented by a series of data points connected with a straight line. Explaining the meaning of “What is a line chart?” is convenient to use illustrations with professional looking line charts designed in ConceptDraw PRO diagramming and vector drawing software extended with Line Graphs solution from the Graphs and Charts area.Pie Graph Worksheets
Pie Graph is very popular kind of charts which is widely used in various fields of science and life activities. ConceptDraw PRO extended with Pie Charts Solution from the Graphs and Charts area is the best software for drawing the Pie Graph Worksheets.Step Area Graph
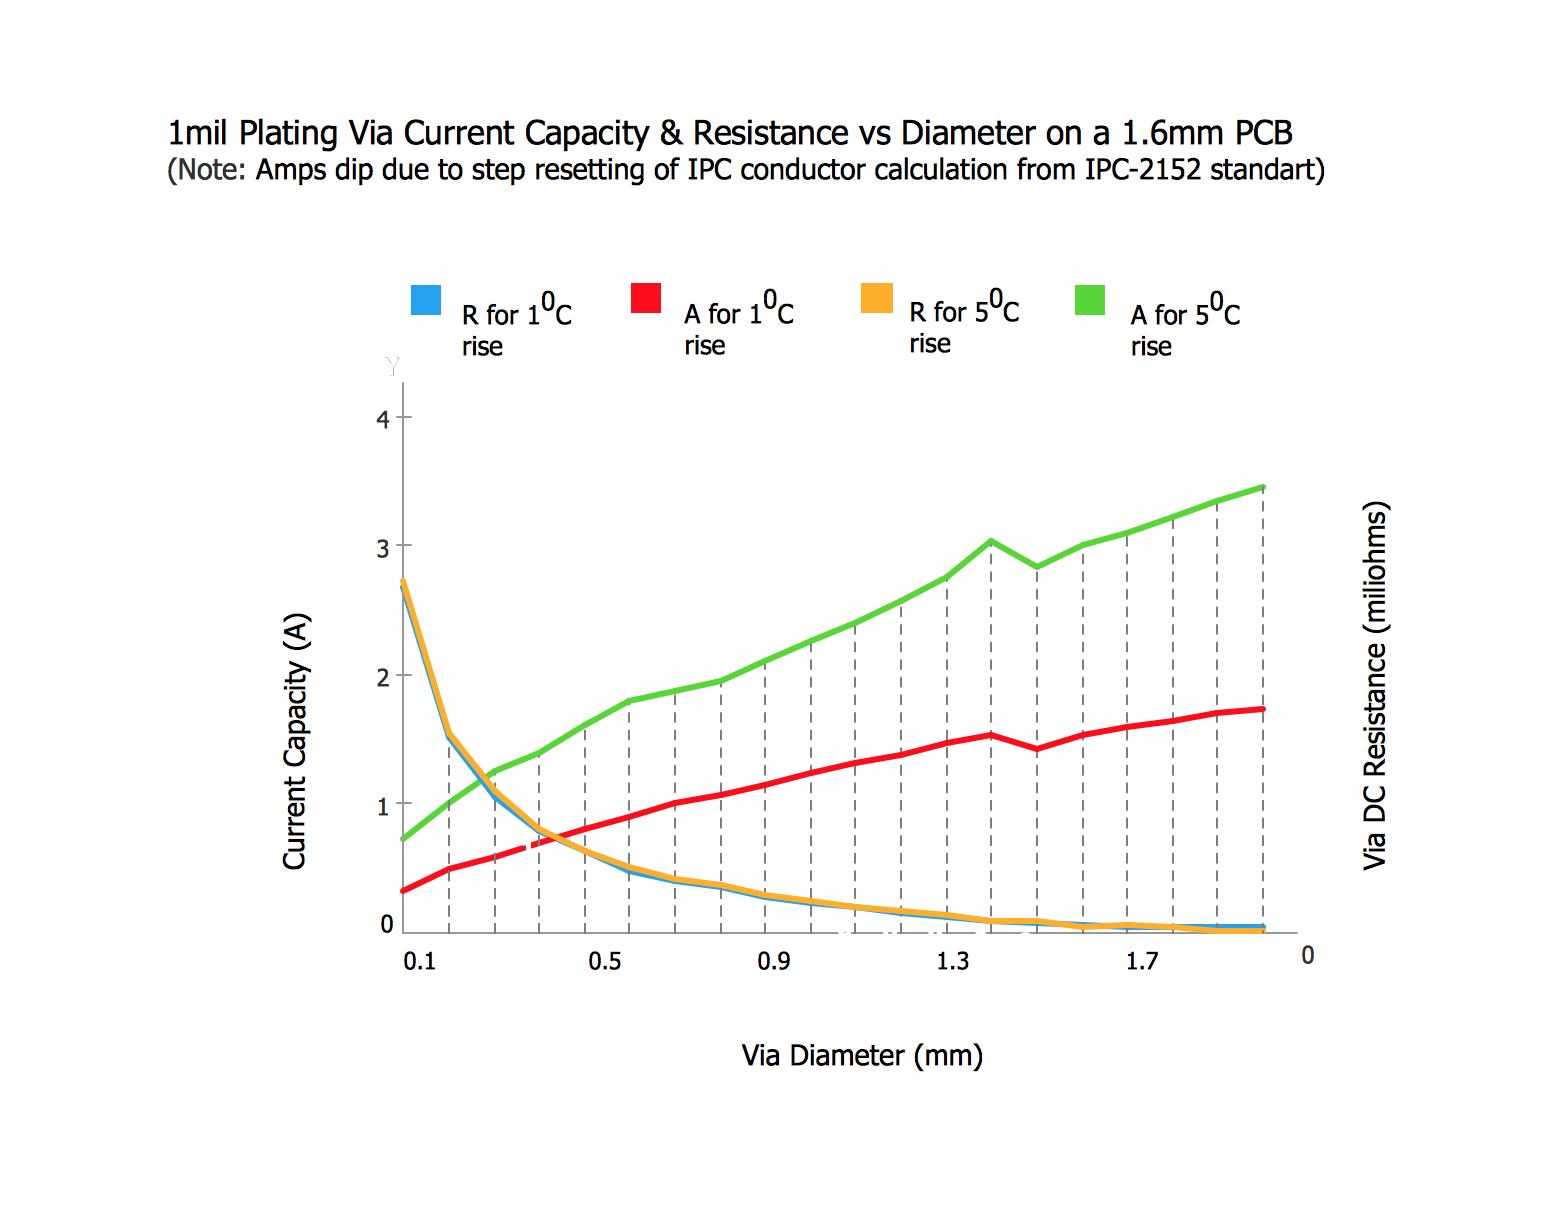
This sample shows the Step Area Graph of the PCB (Printed circuit board) Via current capacity and can be useful in electronics. It is displayed 1 mil plating Via current capacity and the resistance vs diameter on a 1.6 mm PCB. A via is an electrical connection between the layers in the electronical circuit that in PCB consists of two pads on the different electrically connected layers of the board.Line Chart Template for Word
This sample was created in ConceptDraw PRO diagramming and vector drawing software using the Line Graphs Solution from Graphs and Charts area of ConceptDraw Solution Park.This sample shows the Line Chart of annual percentage change. The Line Chart allows you to clearly see the changes of data over the time.
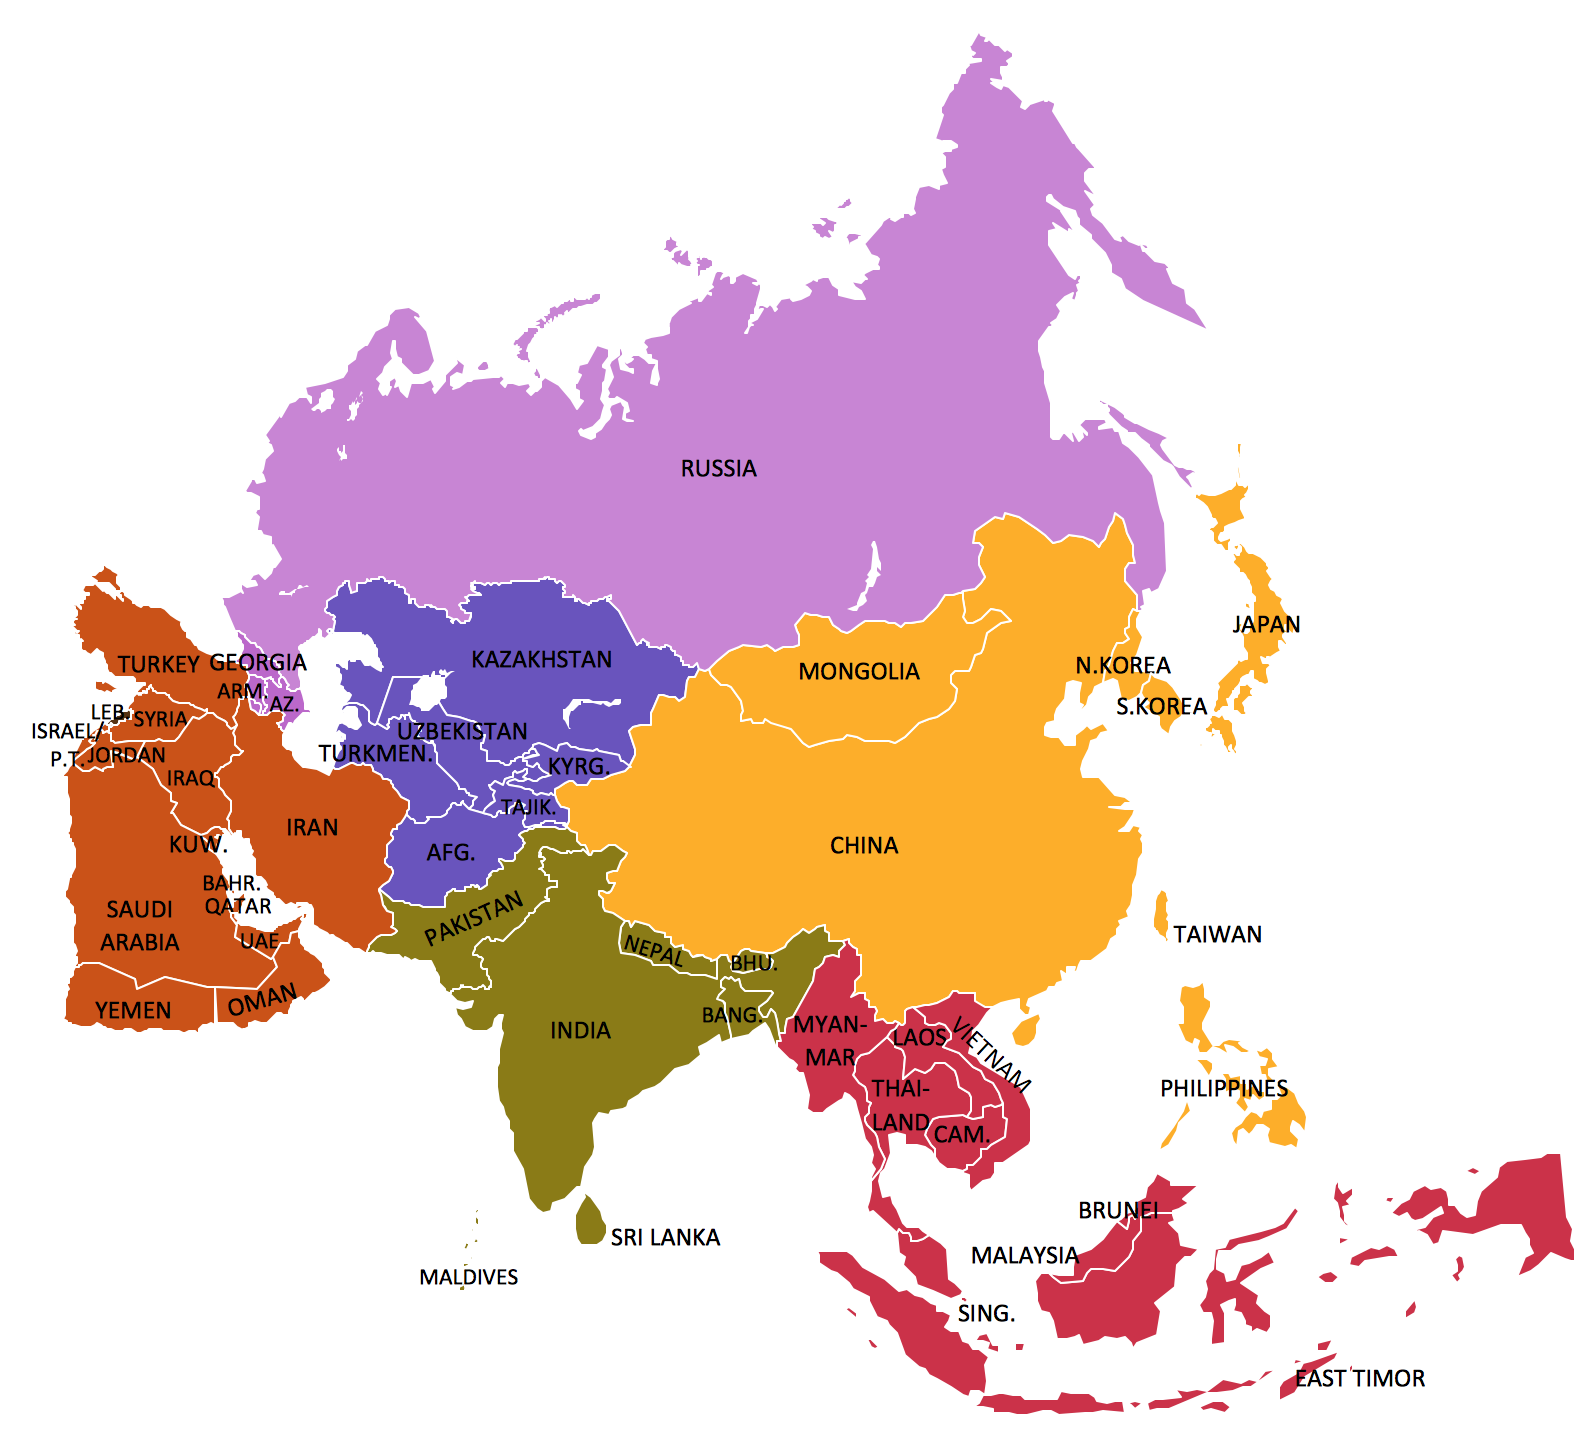
Geo Map - Asia
ConceptDraw is idea to draw the geological maps of Asia from the pre-designed vector geo map shapes.Use Geo Map Asia to draw thematic maps, geospatial infographics and vector illustrations for your business documents, presentations and websites.
 Area Charts
Area Charts are used to display the cumulative totals over time using numbers or percentages; or to show trends over time among related attributes. The Area Chart is effective when comparing two or more quantities. Each series of data is typically represented with a different color, the use of color transparency in an object’s transparency shows overlapped areas and smaller areas hidden behind larger areas.
Scatter Graph Charting Software
ConceptDraw provides some interactive xy chart and scatter graph symbols that offers advanced features yet is simple to use.Histogram
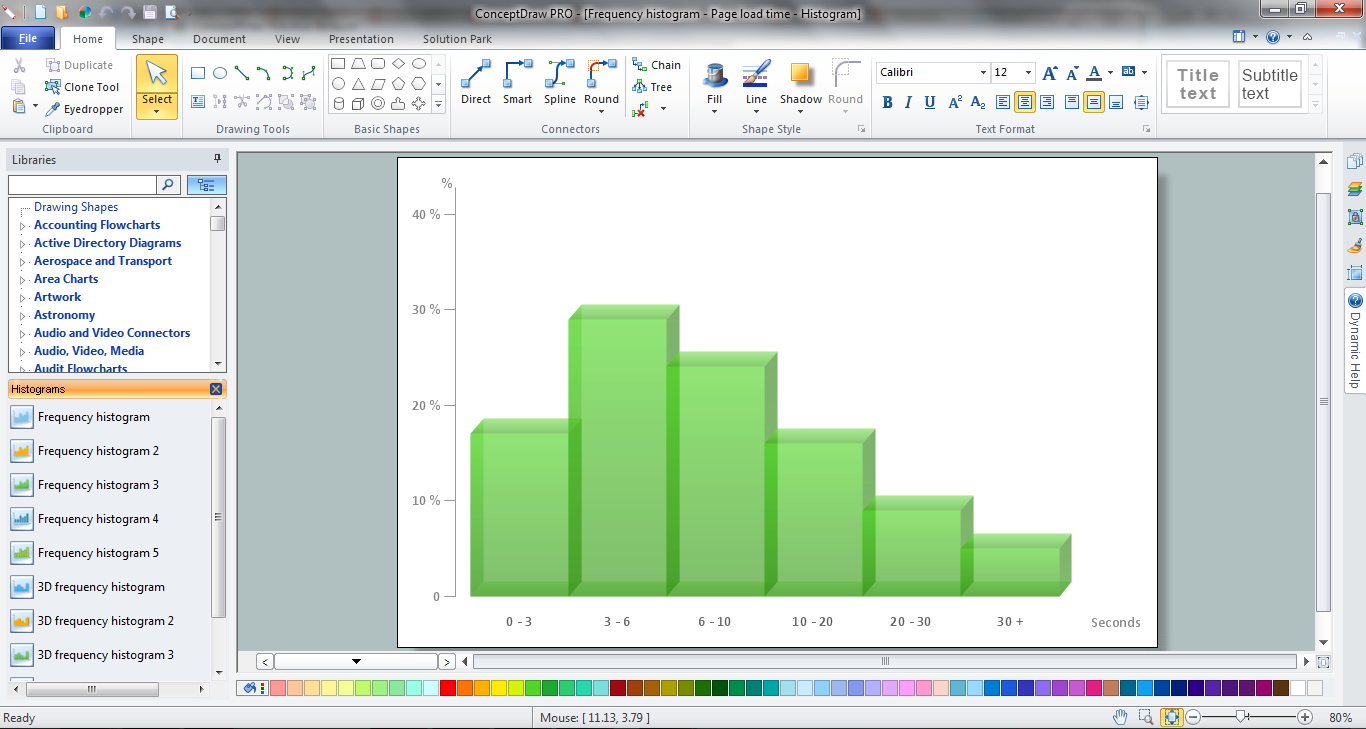
ConceptDraw PRO diagramming and vector drawing software offers the Histograms solution from the Graphs and Charts area of ConceptDraw Solution Park with powerful tools to help you draw a Histogram of any complexity quick and easy.Basic Diagramming
Perfect charts and graphics diagramming software with rich examples and template. ConceptDraw is ideal to draw Charts and Graphics.
Geo Map - Europe - Belarus
The vector stencils library Belarus contains contours for ConceptDraw PRO diagramming and vector drawing software. This library is contained in the Continent Maps solution from Maps area of ConceptDraw Solution Park.- Bar Graph Of Population Growth Rate
- Bar Graph Template Population Increase
- Picture Graph | Pictures of Graphs | Sales Growth . Bar Graphs ...
- Basic Diagramming | Picture Graphs | Population Growth Bar Chart
- Basic Diagramming | Sales Growth . Bar Graphs Example | Pictures ...
- Basic Diagramming | Picture Graphs | Bar Chart Population Growth
- Picture Graphs | How to Create a Picture Graph in ConceptDraw ...
- Image chart - The total financing of the Philippines from 2001-2010 ...
- Basic Diagramming | Sales Growth . Bar Graphs Example | Area ...
- Line Chart Example Of Population Growth
- Videos Bar Graph Growth In Population
- Bar Graphs | Line Graphs | Sales Growth . Bar Graphs Example ...
- Picture Graph
- Basic Diagramming | Population Growth Line Graph
- Barrie population - Picture bar graph | Picture Graph | Sales Growth ...
- Basic Diagramming | Line Graphs | Sales Growth . Bar Graphs ...
- Picture Graphs | Sales Growth . Bar Graphs Example | Barrie ...
- Picture Graph | Sales Growth . Bar Graphs Example | Line Graph ...
- Pictures of Graphs | Population growth by continent, 2010 - 2013 ...
- Pics Of Populations Bar Graphs


