 Bar Graphs
The Bar Graphs solution enhances ConceptDraw PRO v10 functionality with templates, numerous professional-looking samples, and a library of vector stencils for drawing different types of Bar Graphs, such as Simple Bar Graph, Double Bar Graph, Divided Bar Graph, Horizontal Bar Graph, Vertical Bar Graph, and Column Bar Chart.
The vector stencils library "Picture Graphs" contains 35 templates of picture bar graphs for visual data comparison and time series.
Drag a template from the library to your document, set bars number, type category labels, select bars and enter your data.
Use these shapes to draw your pictorial bar charts in the ConceptDraw PRO diagramming and vector drawing software.
The vector stencils library "Picture Graphs" is included in the Picture Graphs solution from the Graphs and Charts area of ConceptDraw Solution Park.
Arrow
Water drop

Food

Grain

Agriculture

Medicines

Houses

Buildings

Money bags

Oil barrels

Natural gas

Electrical power

Nuclear power

Mechanical engineering

Chemical industry

Mining

Gold bars

Coins

Person

Men, women and children

Man

Woman

Child

Milk

Meat

Fruits

Vegetables

Computer

Mobile phone

Airliner

Car

Bus

Truck

Train

Cargo ship

Column Chart Software

The 3D vertical bar graph sample shows the Iran internet users per 100 person from 2000 to 2011. It was designed on the base of the Commons Wikimedia file: Iran internet users per 100 person.png.
[commons.wikimedia.org/ wiki/ File:Iran_ internet_ users_ per_ 100_ person.png]
This file is licensed under the Creative Commons Attribution-Share Alike 3.0 Unported license. [creativecommons.org/ licenses/ by-sa/ 3.0/ deed.en]
The data source is World Bank: [data.worldbank.org/ country/ iran-islamic-republic]
"In 1993 Iran became the second country in the Middle East to be connected to the Internet, and since then the government has made significant efforts to improve the nation's ICT infrastructure. Iran's national Internet connectivity infrastructure is based on two major networks: the public switched telephone network (PSTN) and the public data network. The PSTN provides a connection for end-users to Internet service providers (ISPs) over mostly digital lines and supports modem-based connections. The Data Communication Company of Iran (DCI), a subsidiary of TCI, operates the public data network." [Internet in Iran. Wikipedia]
The 3D column chart example "Iran internet users per 100 person" was created using the ConceptDraw PRO diagramming and vector drawing software extended with the Bar Graphs solution from the Graphs and Charts area of ConceptDraw Solution Park.
3D Column chart

This picture bar graph sample shows the Barrie population growth from 1981 to 2006. It was designed on the base of the Wikimedia Commons file: Barrie Population.jpg.
[commons.wikimedia.org/ wiki/ File:Barrie_ Population.jpg]
"Barrie is a city in Central Ontario, Canada, on the western shore of Lake Simcoe. Although located in Simcoe County, the city is politically independent. Barrie is within the northern part of the Greater Golden Horseshoe, a densely populated and industrialized region of Ontario.
In 2011 census, the city's population was originally reported as 135,711, making it the 34th largest in Canada. The city's 2011 population was subsequently revised to 136,063. The Barrie census metropolitan area (CMA) had a population of 187,013 residents, making it the 21st largest CMA in Canada." [Barrie. Wikipedia]
The pictorial chart example "Barrie population" was created using the ConceptDraw PRO diagramming and vector drawing software extended with the Picture Graphs solution from the Graphs and Charts area of ConceptDraw Solution Park.
Picture bar graph
Financial Comparison Chart

This picture bar graph sample shows increse in subscibers on YouTube to Anonymous' videos in 2008. It was designed on the base of the Wikimedia Commons file: A graph to show the increse in subscibers on YouTube to Anonymous' videos.jpg. [commons.wikimedia.org/ wiki/ File:A_ graph_ to_ show_ the_ increse_ in_ subscibers_ on_ YouTube_ to_ Anonymous%27_ videos.jpg]
This file is licensed under the Creative Commons Attribution 3.0 Unported license. [creativecommons.org/ licenses/ by/ 3.0/ deed.en]
"Anonymous (used as a mass noun) is a loosely associated international network of activist and hacktivist entities. A website nominally associated with the group describes it as "an internet gathering" with "a very loose and decentralized command structure that operates on ideas rather than directives". The group became known for a series of well-publicized publicity stunts and distributed denial-of-service (DDoS) attacks on government, religious, and corporate websites.
Anonymous originated in 2003 on the imageboard 4chan, representing the concept of many online and offline community users simultaneously existing as an anarchic, digitized global brain. Anonymous members (known as "Anons") can be distinguished in public by the wearing of stylised Guy Fawkes masks." [Anonymous (group). Wikipedia]
The pictorial chart example "The increse in subscibers on YouTube to Anonymous' videos" was created using the ConceptDraw PRO diagramming and vector drawing software extended with the Picture Graphs solution from the Graphs and Charts area of ConceptDraw Solution Park.
Image chart
Bar Diagrams for Problem Solving. Create manufacturing and economics bar charts with Bar Graphs Solution

Column Chart Examples

Basic Flowchart Symbols and Meaning


Chart Examples

Chart Templates

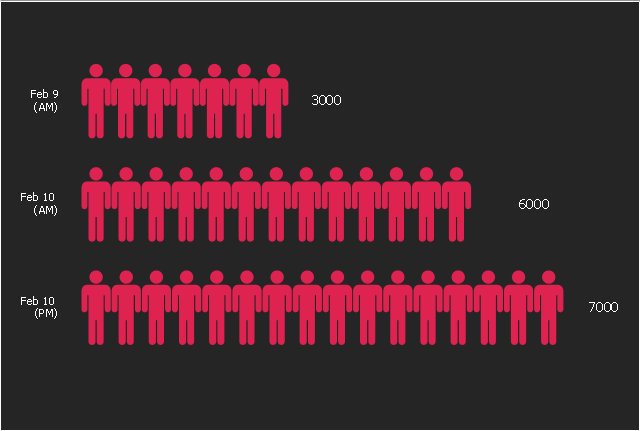
The vector stencils library "Picture bar graphs" contains 35 templates of pictorial charts. Use it for visualization of data comparison and time series with ConceptDraw PRO diagramming and vector drawing software.
"Pictorial bar graph.
Sometimes reffered to as a pictographs. A pictorial bar graph is a graph in which the rectangular bars have been filled with pictures, sketches, icons, etc. or where pictures, sketches, icons, etc. have been substituted for the rectangular bars. In both variations, one or more symbols might be used in each bar. The two major reasons for using pictorial graphs are to make the graph more appealing visually and to facilitate better communications." [Information Graphics: A Comprehensive Illustrated Reference. R. L. Harris. 1999. p.41]
The pictorial charts example "Design elements - Picture bar graphs" is included in the Picture Graphs solution from the Graphs and Charts area of ConceptDraw Solution Park.
Templates

Column Chart Template

- Bar Graphs | 3D Column chart - Iran internet users per 100 person ...
- Bar Graphs | Cross-Functional Flowchart | Flow chart Example ...
- Bar Graphs | 3D Column chart - Iran internet users per 100 person ...
- 3D Column chart - Iran internet users per 100 person | Bar Graphs ...
- Picture graphs - Vector stencils library | Bar Diagrams for Problem ...
- Bar Graph On Food
- Design elements - Picture bar graphs | Picture graphs - Vector ...
- Bars Graph Png
- How to Create a Bar Chart in ConceptDraw PRO | Bar Diagrams for ...
- Recruitment | Bar Graphs | Cafe and Restaurant Floor Plans | 15 ...
- Bar Graphs | Bar Chart Software | Bar Chart Examples | Horizontal ...
- Person Symbol Bar Graph
- Workflow Diagrams | Bar Graphs | Note Exchange | Diagram Of The ...
- Bar Graphs | How to Create a Bar Chart in ConceptDraw PRO ...
- Bar Graph On Agriculture
- Pictorial Bar Chart
- Design elements - Picture bar graphs | Barrie population - Picture ...
- Bar Graphs | Sales Growth. Bar Graphs Example | Bar Diagrams for ...
- How to Draw a Divided Bar Chart in ConceptDraw PRO | Divided ...
- Bar Graph | Picture graphs - Vector stencils library | Sales Growth ...