Bar Chart Examples
Complete set of bar chart examples is produced using ConceptDraw software. Surfing bar chart examples you can find an example that is the best for your case.Business Report Pie. Pie Chart Examples
This sample shows the Business Report Pie Chart. The Pie Chart visualizes the data as the proportional parts of a whole, illustrates the numerical proportion. Pie Charts are very useful in the business, statistics, analytics, mass media.Pie Chart Examples and Templates
A pie chart or a circle graph is a circular chart divided into sectors, illustrating numerical proportion. In a pie chart, the arc length of each sector and consequently its central angle and area, is proportional to the quantity it represents. Pie chart examples and templates created using ConceptDraw PRO software helps you get closer with pie charts and find pie chart examples suite your needs.Chart Examples
Easy charting software comes with beautiful chart templates and examples. This makes it easy to create professional charts without prior experience.
 Entity-Relationship Diagram (ERD)
Entity-Relationship Diagram (ERD) solution extends ConceptDraw PRO software with templates, samples and libraries of vector stencils from drawing the ER-diagrams by Chen's and crow’s foot notations.
Chart Templates
Easy charting software comes with beautiful chart templates and examples. This makes it easy to create professional charts without prior experience.How to Create a Bar Chart
The answer how to create a bar chart can be found in ConceptDraw software. The simple tips guide you through the software to quickly learn how to create a bar chart.Line Charts
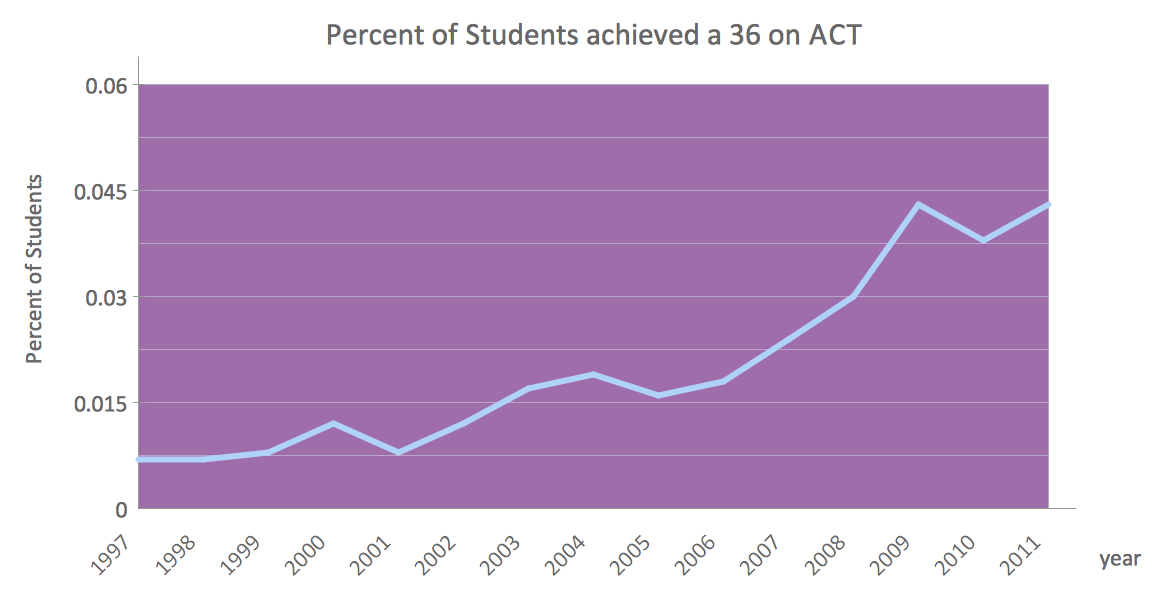
ConceptDraw PRO diagramming and vector drawing software extended with Line Graphs solution from the Graphs and Charts area of ConceptDraw Solution Park is the best for drawing the Line Charts simply and fast.Pie Chart
ConceptDraw PRO diagramming and vector drawing software offers the Pie Charts solution from the Graphs and Charts area of ConceptDraw Solution Park for quick and easy drawing the Pie Chart of any complexity.Business process Flow Chart - Event-Driven Process chain (EPC) diagrams
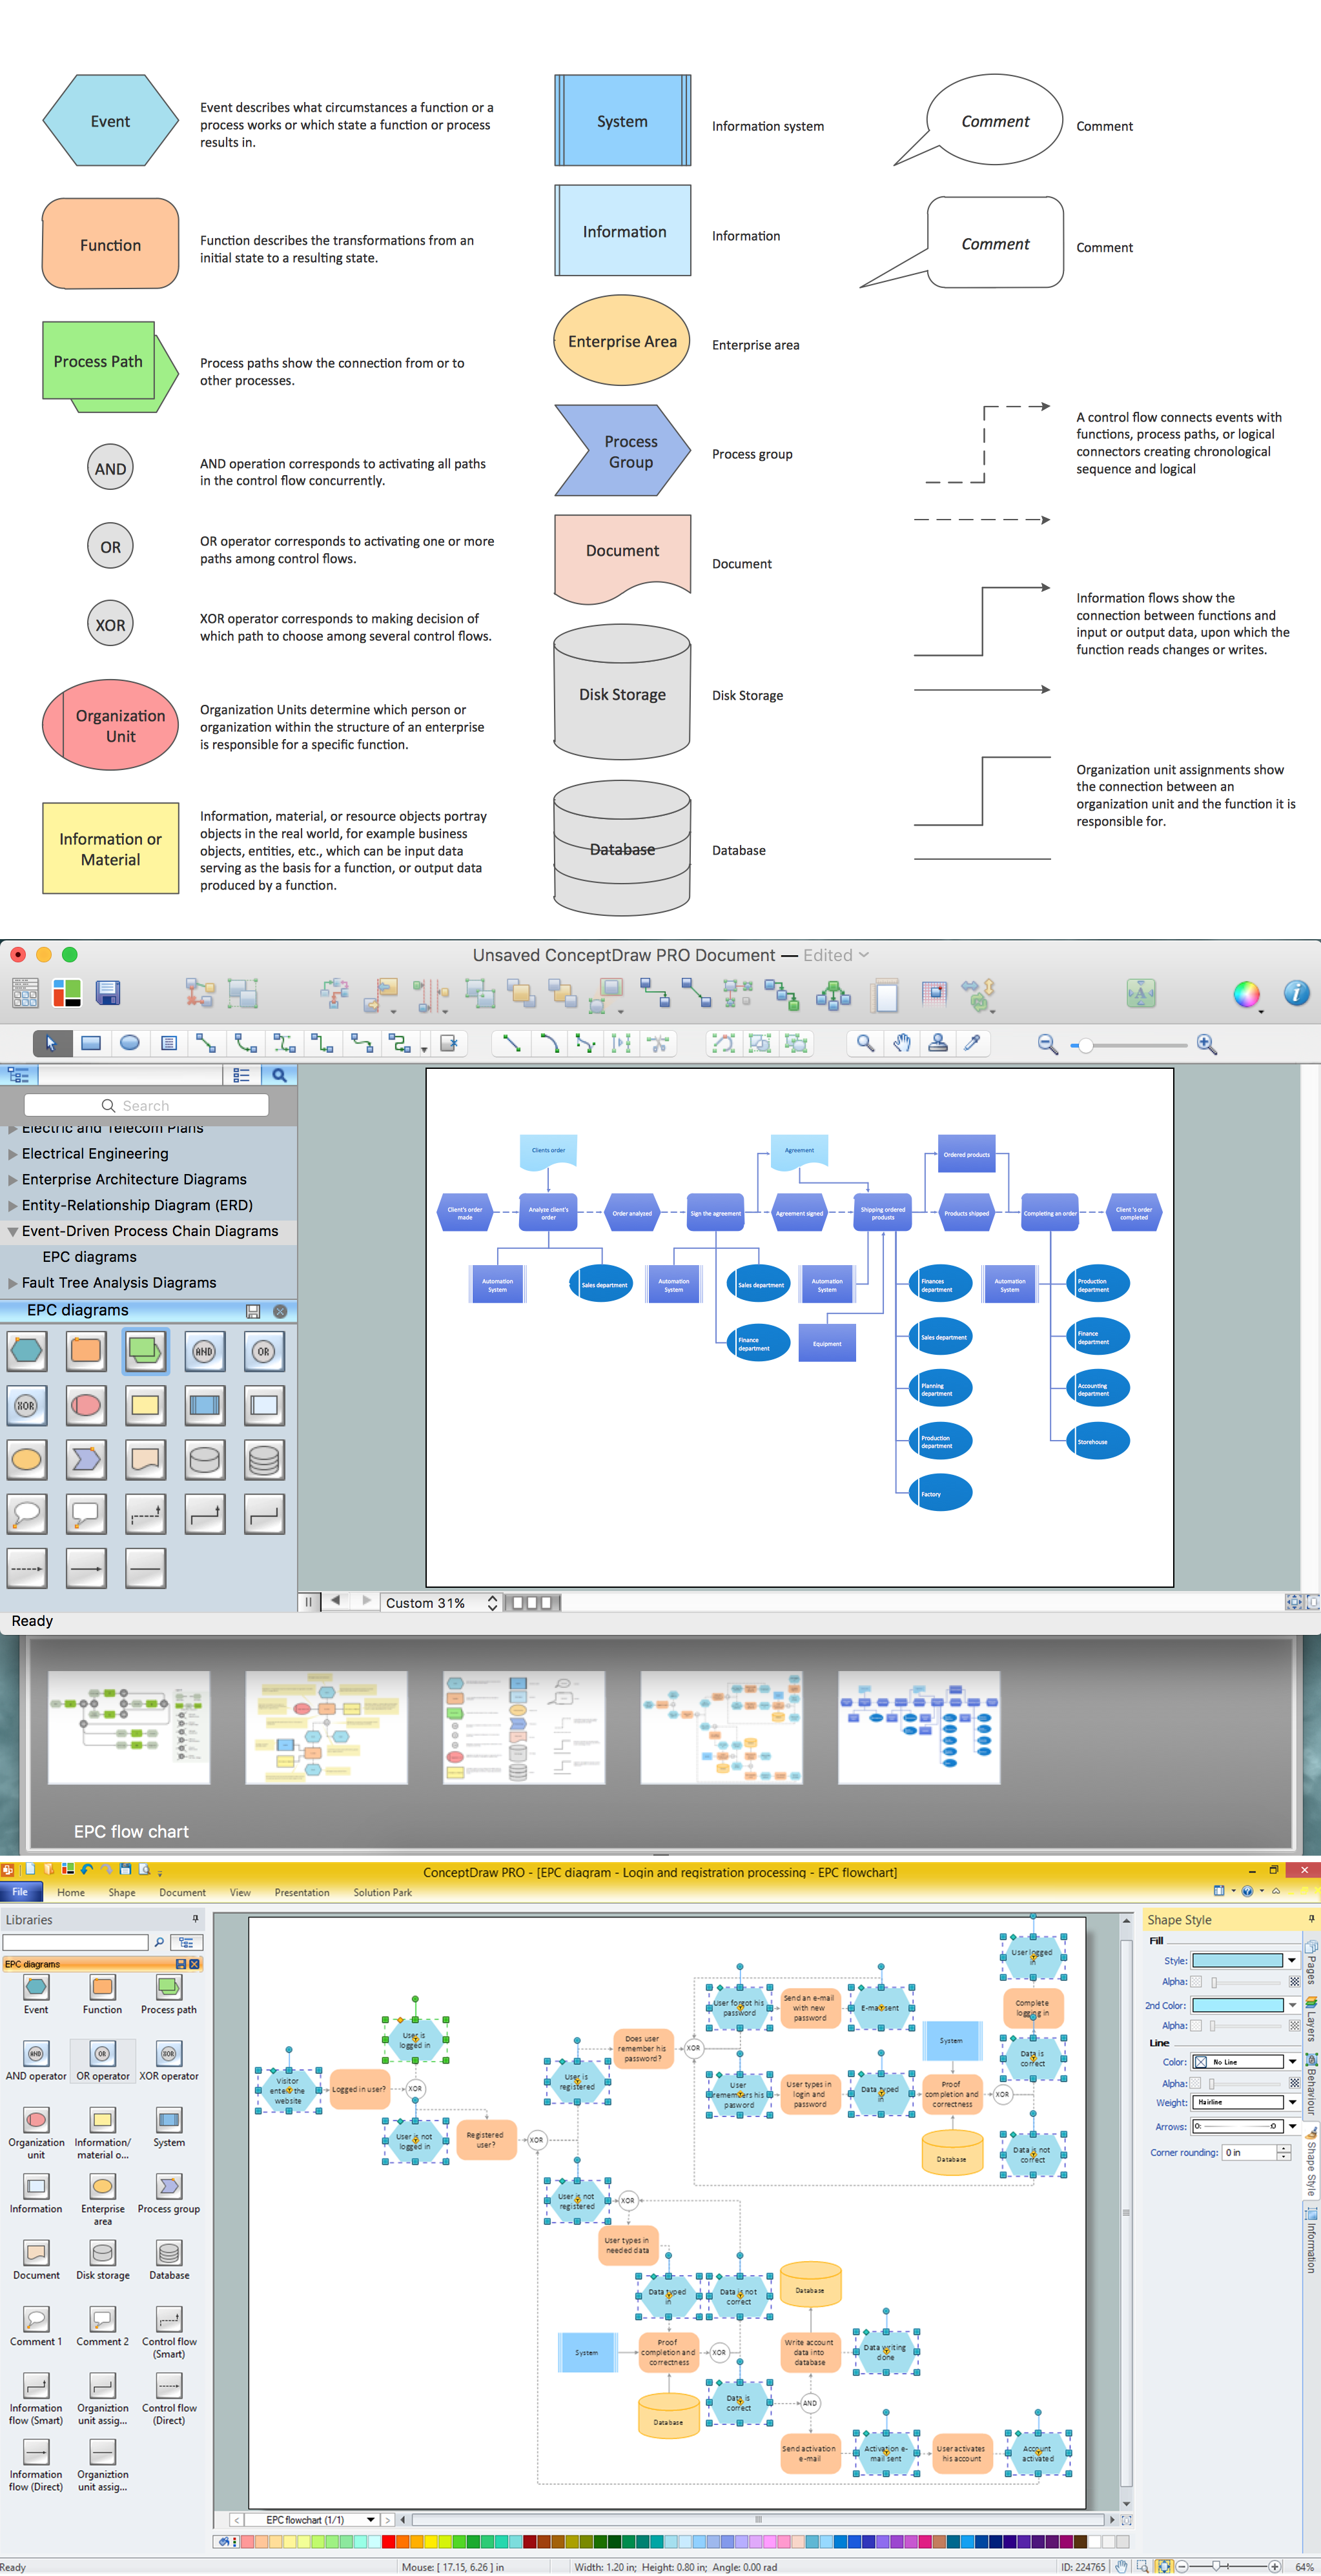
Event-Driven Process chain Diagrams for improvement throughout an organisation. Best software for Process Flow Diagram. The Event-driven Process Chain (EPC) Diagrams allows managers to plan processes and resources.- Sales Growth. Bar Graphs Example | Bar Chart Examples | Bar ...
- Bar Diagrams for Problem Solving. Create business management ...
- Business Bargraph
- Pie Chart Examples and Templates | Bar Chart Examples ...
- Donut Chart Templates | Basic Diagramming | Sales Growth. Bar ...
- Bar Graph Business Management
- Sales Growth. Bar Graphs Example
- Bar Chart Examples | Bar Graph | Business Report Pie. Pie Chart ...
- Bar Graph Of A Business
- Sales Growth. Bar Graphs Example | Rainfall Bar Chart | Sales ...
- Business Plan Explain Bar Chart Pie Chart With Explained
- Different Types Of Business Management Charts And Graph
- Bar Diagrams for Problem Solving. Create manufacturing and ...
- Business Bar Graph And Information
- Bar Grph Use In Business
- Pie Chart Examples and Templates | Business Report Pie. Pie Chart ...
- Waterfall Bar Chart | Process Flowchart | Chart Examples | Describe ...
- Diagram Of Histogram And Bar Chart According To Economics
- How to Create a Bar Chart in ConceptDraw PRO | Bar Graph | How ...
- Dividing Bar Graph Y Axis


