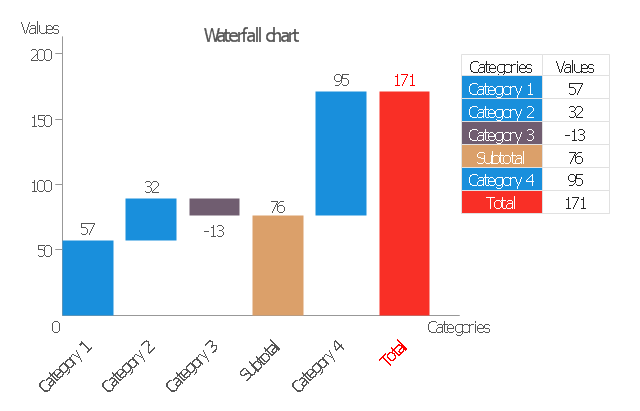
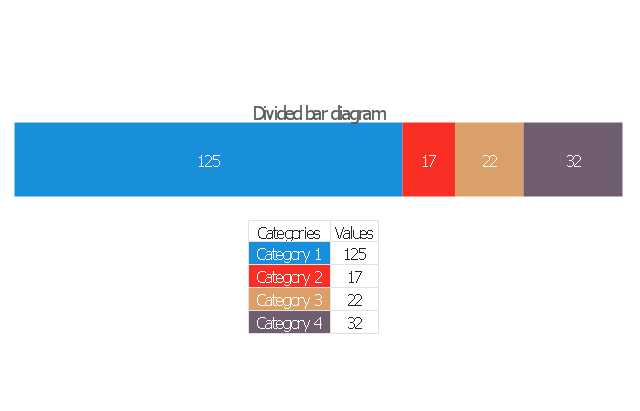
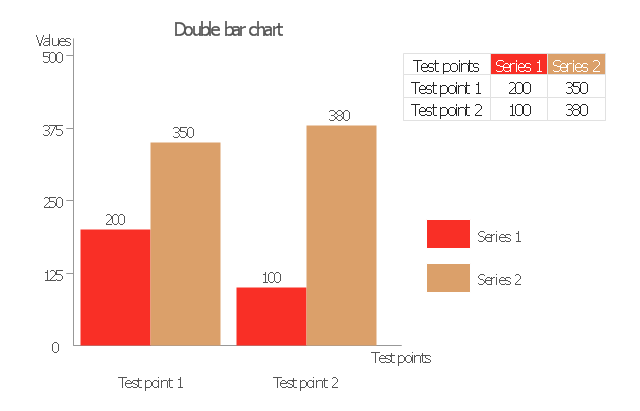
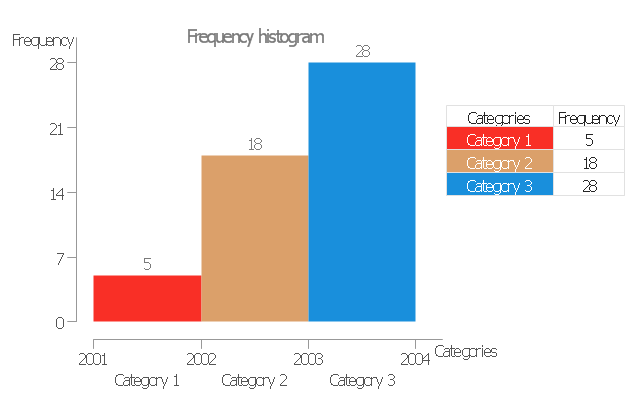
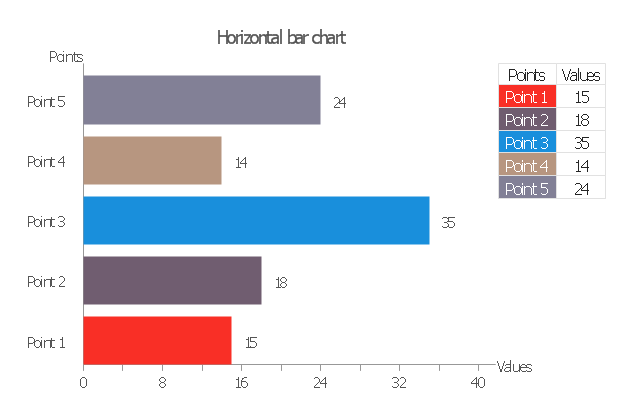
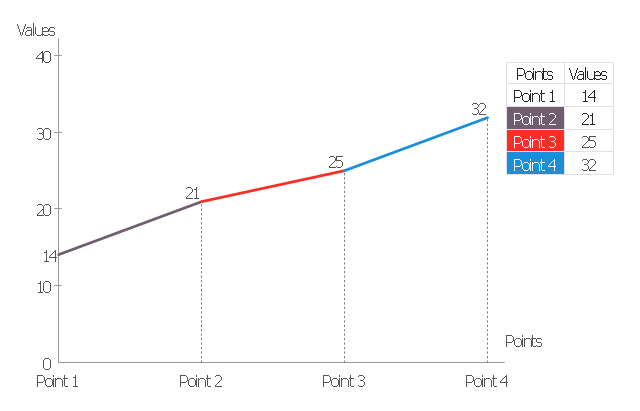
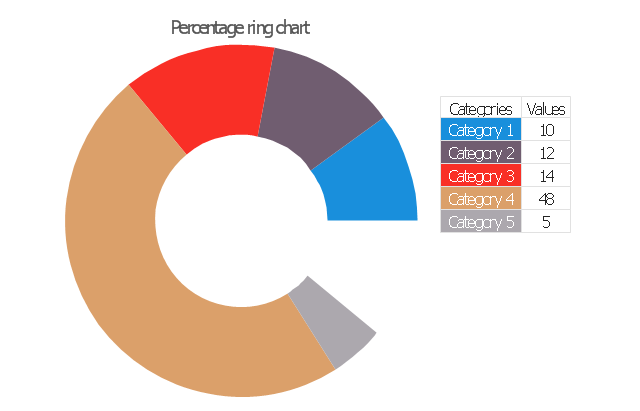
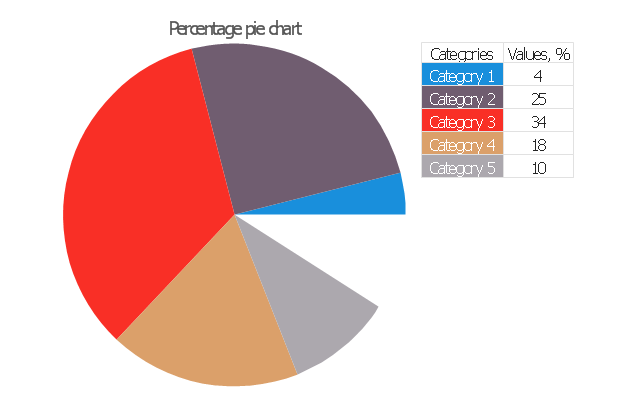
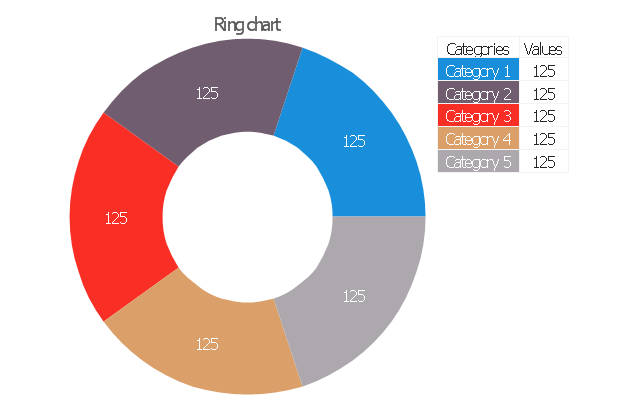
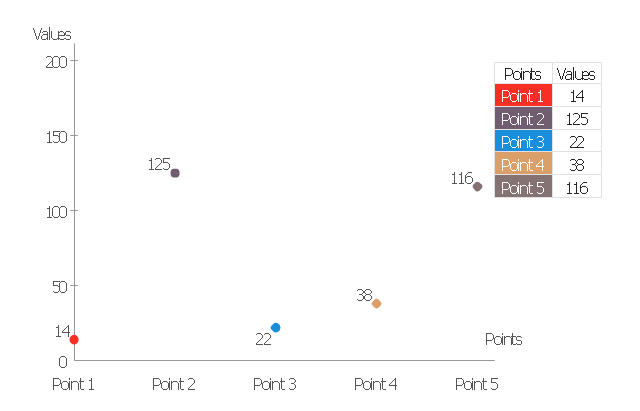
The vector stencils library "Data-driven charts" contains 13 data-driven graphs and charts: area chart, divided bar diagram, double bar graph, frequency histogram, horizontal bar chart, line graph, percentage ring chart, percentage pie chart, scatter plot, column chart, waterfall chart.
Use it to visualize quantitative data in your data-driven infographics.
The graphs example "Data-driven charts - Vector stencils library" was created using the ConceptDraw PRO diagramming and vector graphics software extended with the Data-driven Infographics solution from the area "What is infographics" of ConceptDraw Solution Park.
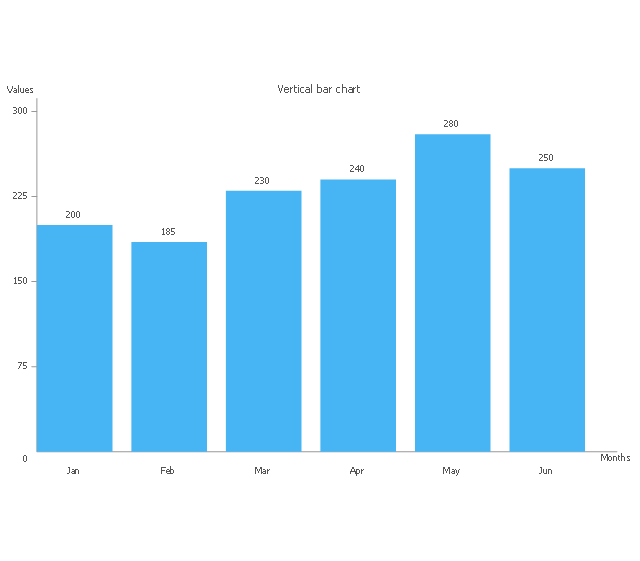
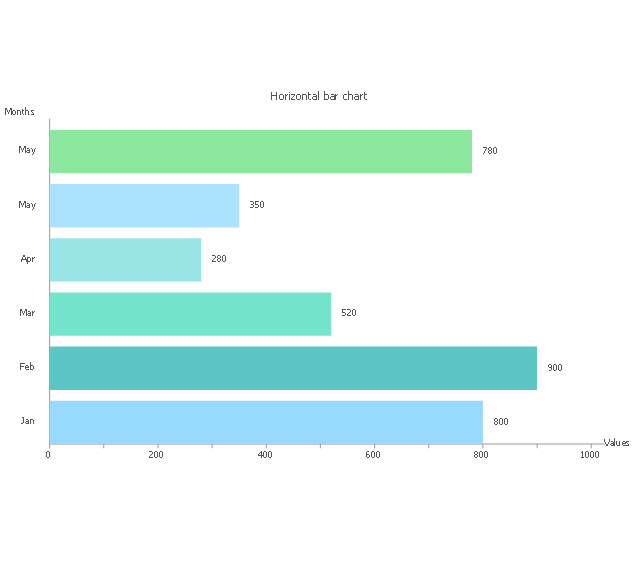
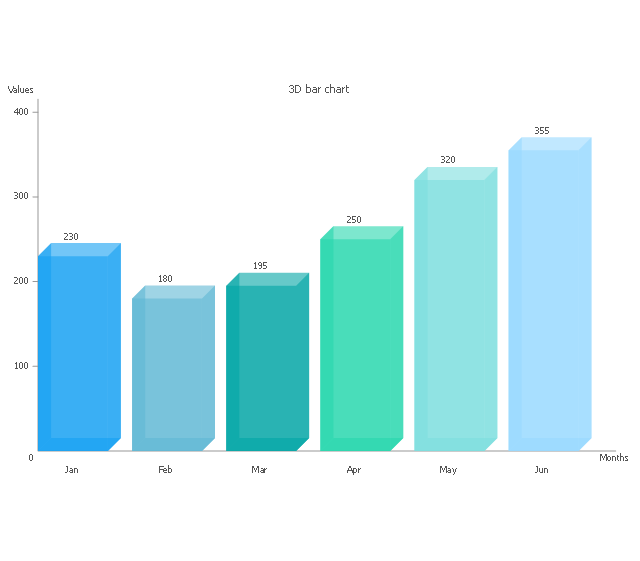
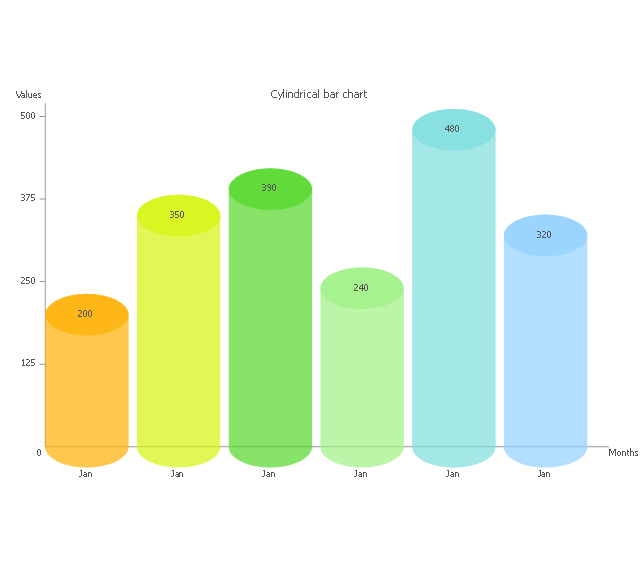
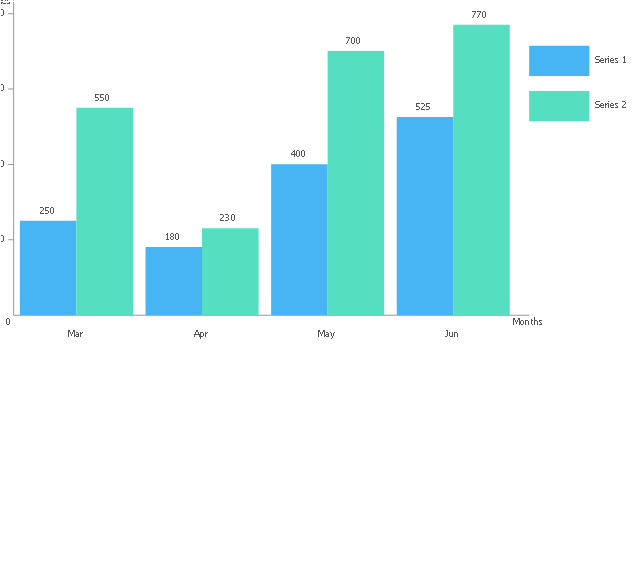
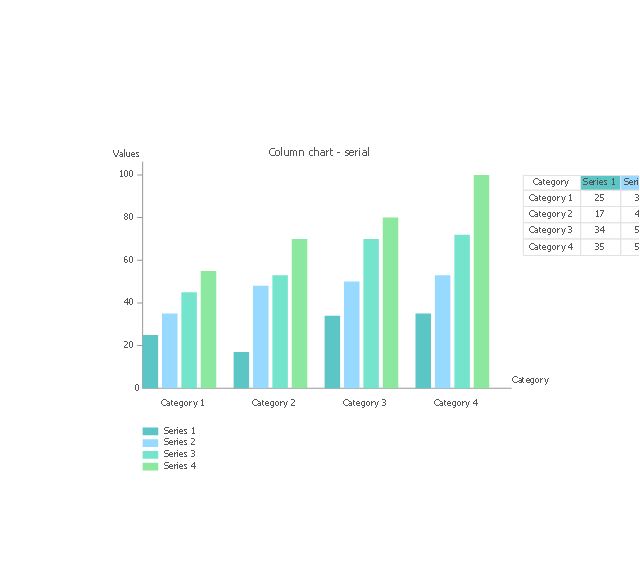
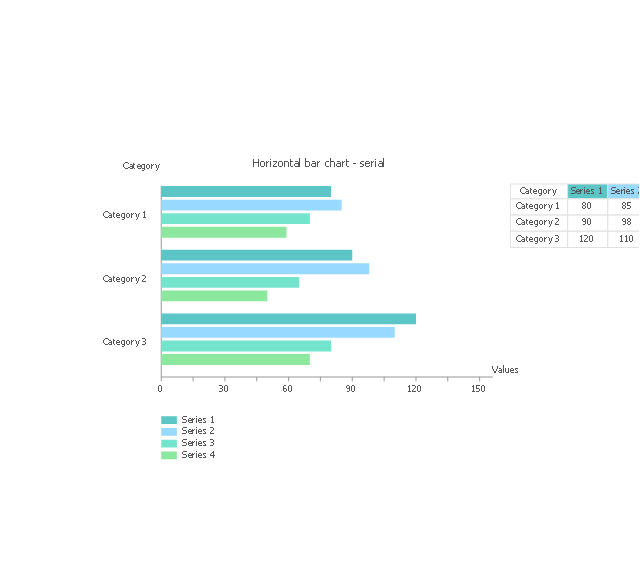
The vector stencils library "Bar charts" contains 7 templates of bar and column charts for visualizing quantitative and statistical data comparison and changes in time series. Drag template from library to your document and enter your data.
Use these shapes to draw your bar graphs in the ConceptDraw PRO diagramming and vector drawing software.
The vector stencils library "Bar charts" is included in the Bar Graphs solution from the Graphs and Charts area of ConceptDraw Solution Park.
Use these shapes to draw your bar graphs in the ConceptDraw PRO diagramming and vector drawing software.
The vector stencils library "Bar charts" is included in the Bar Graphs solution from the Graphs and Charts area of ConceptDraw Solution Park.
 Area Charts
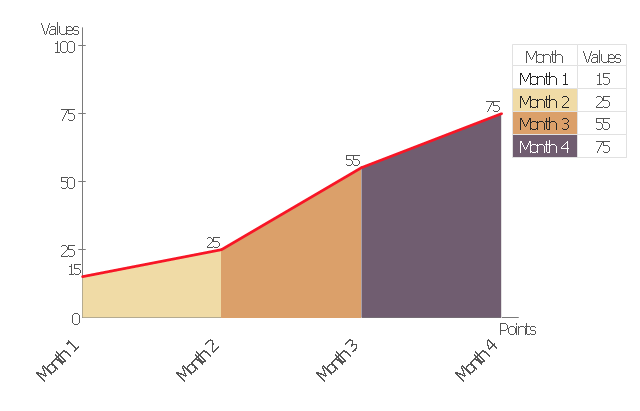
Area Charts are used to display the cumulative totals over time using numbers or percentages; or to show trends over time among related attributes. The Area Chart is effective when comparing two or more quantities. Each series of data is typically represented with a different color, the use of color transparency in an object’s transparency shows overlapped areas and smaller areas hidden behind larger areas.
Line Graph Charting Software
To design line and scatter charts use ConceptDraw PRO diagramming and vector drawing software extended with Line Graphs solution from Graphs and Charts area of ConceptDraw PRO Solution Park. (Line chart, scatter chart, 2d chart).Competitor Analysis
Competitor analysis is a first and obligatory step in elaboration the proper corporate marketing strategy and creating sustainable competitive advantage. Use powerful opportunities of numerous solutions from ConceptDraw Solution Park for designing illustrative diagrams, charts, matrices which are necessary for effective competitor analysis.
 Correlation Dashboard
Correlation dashboard solution extends ConceptDraw PRO software with samples, templates and vector stencils library with Scatter Plot Charts for drawing the visual dashboard visualizing data correlation.
 What are Infographic Area
Solutions of the area What is Infographics from ConceptDraw Solution Park collect templates, samples and vector stencils libraries with design elements for the drawing information graphics.
 Line Graphs
How to draw a Line Graph with ease? The Line Graphs solution extends the capabilities of ConceptDraw PRO v10 with professionally designed templates, samples, and a library of vector stencils for drawing perfect Line Graphs.
Making a Histogram
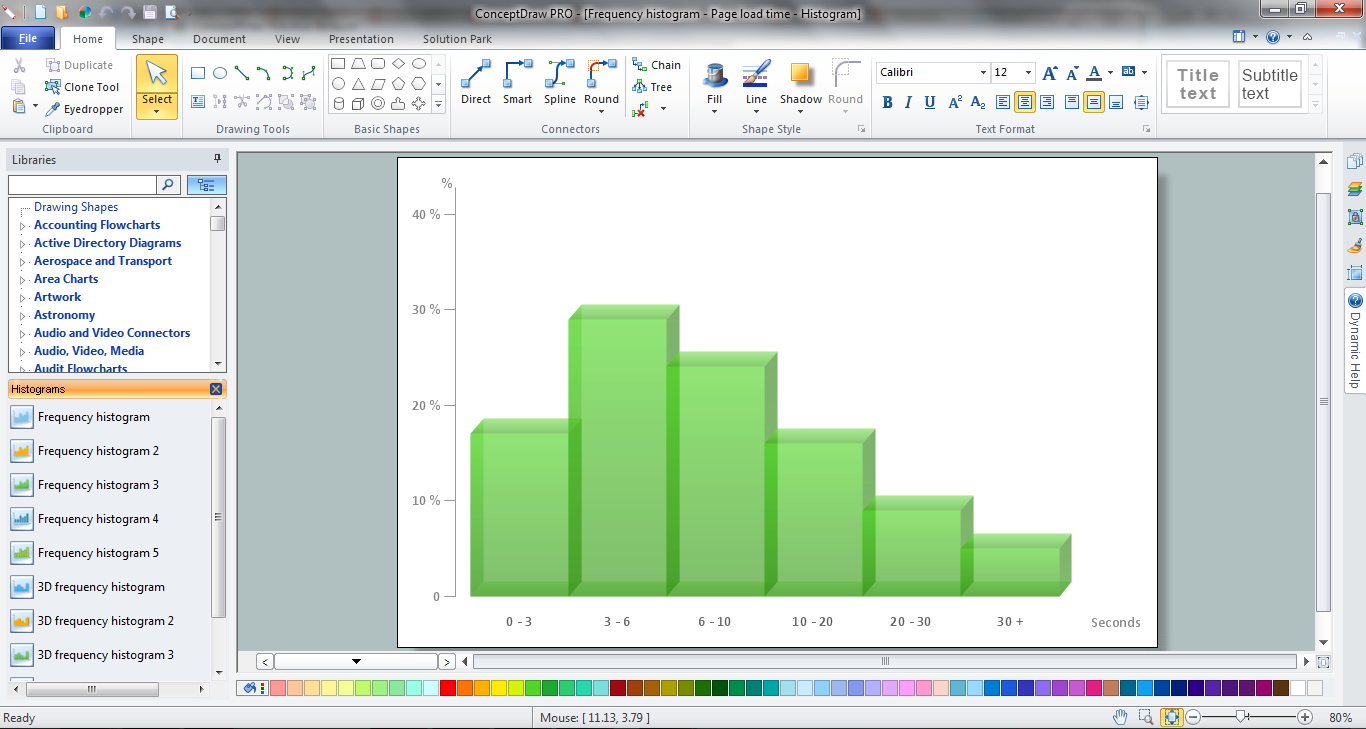
ConceptDraw PRO is a powerful diagramming and vector drawing software. Extended with Histograms solution from the Graphs and Charts area, ConceptDraw PRO became the ideal software for making a Histogram.
 Histograms
How to make a Histogram? Making a Histogram is an incredibly easy process when it is done with ConceptDraw PRO. The Histograms Solution enhances ConceptDraw PRO v10 functionality with extensive drawing tools, numerous samples, and examples; also a quick-start template and library of ready vector stencils for visualization the data and professional drawing Histograms.
Histogram
ConceptDraw PRO diagramming and vector drawing software offers the Histograms solution from the Graphs and Charts area of ConceptDraw Solution Park with powerful tools to help you draw a Histogram of any complexity quick and easy.
 Germany Map
The Germany Map solution contains collection of samples, templates and scalable vector stencil graphic maps, representing map of Germany and all 16 states of Germany. Use the Germany Map solution from ConceptDraw Solution Park as the base for various them
 Meter Dashboard
Meter dashboard solution extends ConceptDraw PRO software with templates, samples and vector stencils library with meter indicators for drawing visual dashboards showing quantitative data.
 Continent Maps
Continent Maps solution extends ConceptDraw PRO software with templates, samples and libraries of vector stencils for drawing the thematic maps of continents, state maps of USA and Australia.
How To Make a Histogram?
How to make a Histogram quick and easy? ConceptDraw PRO diagramming and vector drawing software extended with Histograms solution from the Graphs and Charts area will effectively help you in Histogram drawing.- Column Chart Examples | How to Draw a Histogram in ...
- Double bar graph - Template | Double bar chart - Nitrate ...
- Bar Graphs | Quick YouTube Survey | Data -driven charts - Vector ...
- Data -driven charts - Vector stencils library | Pie Chart Software ...
- Line graphs - Vector stencils library | Data -driven charts - Vector ...
- Bar Graphs | Bar Chart Software | Bar Chart Examples | Horizontal ...
- Data -driven charts - Vector stencils library | Financial Comparison ...
- Bar Chart Examples | Chart Templates | Chart Examples | Horizontal ...
- Data -driven charts - Vector stencils library | How to Add Data -driven ...
- Data -driven charts - Vector stencils library | Percentage Pie Chart ...
- Waterfall Bar Chart | Geography - Vector stencils library | Data ...
- Bar Graph | Picture graphs - Vector stencils library | Chart Maker for ...
- Data -driven charts - Vector stencils library | 4d Chart Data
- Bar Chart Examples | How to Create a Bar Chart | Bar Chart ...
- Chart Maker for Presentations | Bar Chart Software | Basic ...
- Data For Bar Diagram
- Bar Graphs | Percentage Pie Chart . Pie Chart Examples | Chart ...
- How to Create a Bar Chart in ConceptDraw PRO | Bar Chart ...
- Divided Bar Diagrams | Bar Graphs | Percentage Pie Chart . Pie ...
- How to Create a Bar Chart in ConceptDraw PRO | 3D Column chart ...

-data-driven-charts---vector-stencils-library.png--diagram-flowchart-example.png)
