 Bar Graphs
The Bar Graphs solution enhances ConceptDraw DIAGRAM functionality with templates, numerous professional-looking samples, and a library of vector stencils for drawing different types of Bar Graphs, such as Simple Bar Graph, Double Bar Graph, Divided Bar Graph, Horizontal Bar Graph, Vertical Bar Graph, and Column Bar Chart.
Column Chart Examples

Scatter Graph

Bar Diagrams for Problem Solving. Create event management bar charts with Bar Graphs Solution

Bar Chart Software

Bar Chart Template

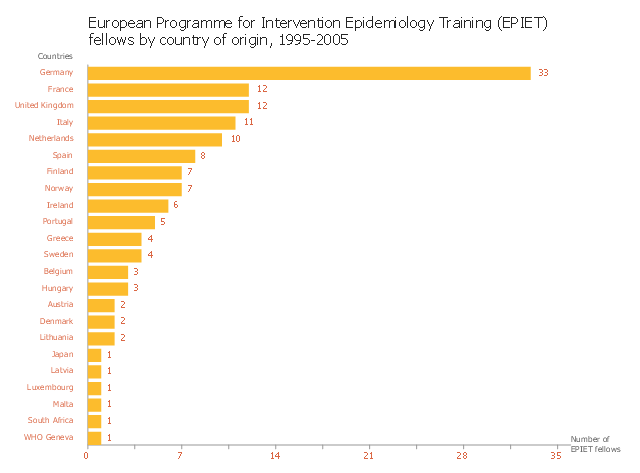
This horizontal bar graph sample shows distribution of European Programme for Intervention Epidemiology Training (EPIET) fellows by country of origin in 1995-2005. It was designed on the base of the bar chart from the website of the Field Epidemiology Manual (FEM) Wiki, the European Programme for Intervention Epidemiology Training (EPIET).
"The simplest bar graph displays data from a table with one variable. Each bar represents one category. Bar graphs can be organised horizontally or vertically. Vertical bars differ from histograms since they are separated by a space. The height of the bar is proportional to the number of events (e.g. cases) in the category, nevertheless the surface is not always proportional to the width of the category on the x-axis (e.g. different width of age groups). If there is a logical order between categories it should be respected. Otherwise categories can be organised along decreasing or increasing values of respective bars. Variables in a bar graph can be discrete (e.g. sex, region, race) or continuous (e.g. age) but organised in categories (e.g. age groups). The x axis does not need to be continuous." [wiki.ecdc.europa.eu/ fem/ w/ wiki/ bar-graphs]
The bar chart example "EPIET fellows by country of origin" was created using the ConceptDraw PRO diagramming and vector drawing software extended with the Bar Graphs solution from the Graphs and Charts area of ConceptDraw Solution Park.
Bar chart
 Seven Basic Tools of Quality
Manage quality control in the workplace, using fishbone diagrams, flowcharts, Pareto charts and histograms, provided by the Seven Basic Tools of Quality solution.
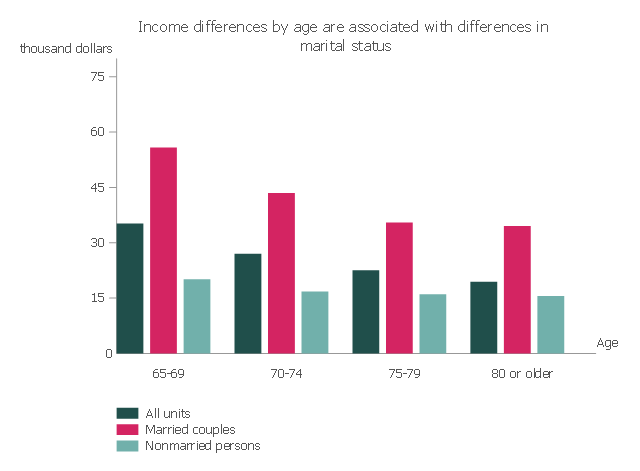
This vertical bar chart sample shows the income differences by age are associated with differences in marital status. It was designed on the base of the bar graph from the webpage "Income of the Aged Chartbook, 2008" on the website of the Social Security Administration, the U.S. Office of Retiriment and Disability Policy.
[ssa.gov/ policy/ docs/ chartbooks/ income_ aged/ 2008/ iac08.html]
"The United States Social Security Administration (SSA) is an independent agency of the United States federal government that administers Social Security, a social insurance program consisting of retirement, disability, and survivors' benefits. To qualify for most of these benefits, most workers pay Social Security taxes on their earnings; the claimant's benefits are based on the wage earner's contributions. Otherwise benefits such as Supplemental Security Income (SSI) are given based on need." [Social Security Administration. Wikipedia]
The column chart example "Median income, by age and marital status" was created using the ConceptDraw PRO diagramming and vector drawing software extended with the Bar Graphs solution from the Graphs and Charts area of ConceptDraw Solution Park.
Column chart
Scatter Plot

- Bar Graphs | Median income, by age and marital status | Bar ...
- Increasing Bar Graph
- Bar chart - Template | Timeline Diagrams | Management Area ...
- Bar Graph | Serious crime in Cincinnati | Bar Diagrams for Problem ...
- Double Bar Graph Examples
- Sales Growth. Bar Graphs Example | Bar Chart Template | Bar Chart ...
- Bar chart - Template | Bar Chart Examples | Bar Chart Software ...
- Double bar graph - Template | Bar Graph | Bar Chart Examples ...
- Scatter Plot | Design elements - Scatterplot | Blank Scatter Plot ...
- Bar Chart Software | Bar Chart Examples | Column Chart Software ...