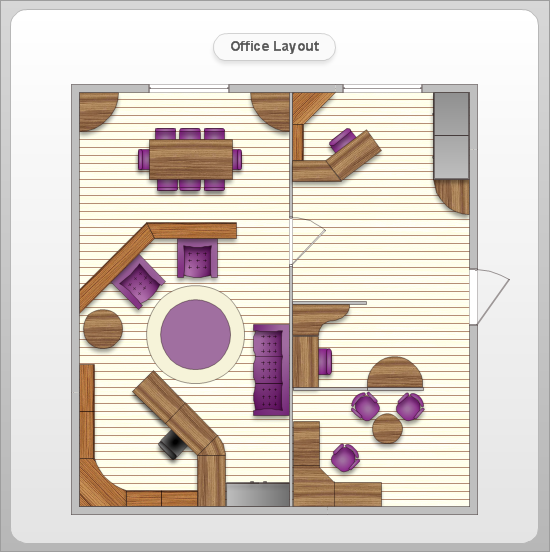
Office Layout
Each office is a unique space, thats why design of office premises has a lot of specifics based on the type of premise and kind of activity of the company which will be placed at this office. Different office concepts and features of office designs are also taken into consideration by designers and architects when office layout plans and designs are created, for construction new office buildings or renovation those built earlier. ConceptDraw DIAGRAM extended with Office Layout Plans solution from Building Plans area is a powerful diagramming and vector drawing software for designing Office Floor Plans, Office Layout Plans, Small Office Design Plans, Office Cabinet Plans, Commercial Floor plans, Home Office Plans, Plans for premises at large office centers, Electrical plans for offices, etc. Office Layout Plans solution includes 3 time-saving libraries of ready-to-use vector objects of office furniture and equipment which are incredibly helpful for design and implementation any of your office layout ideas.
 Plant Layout Plans
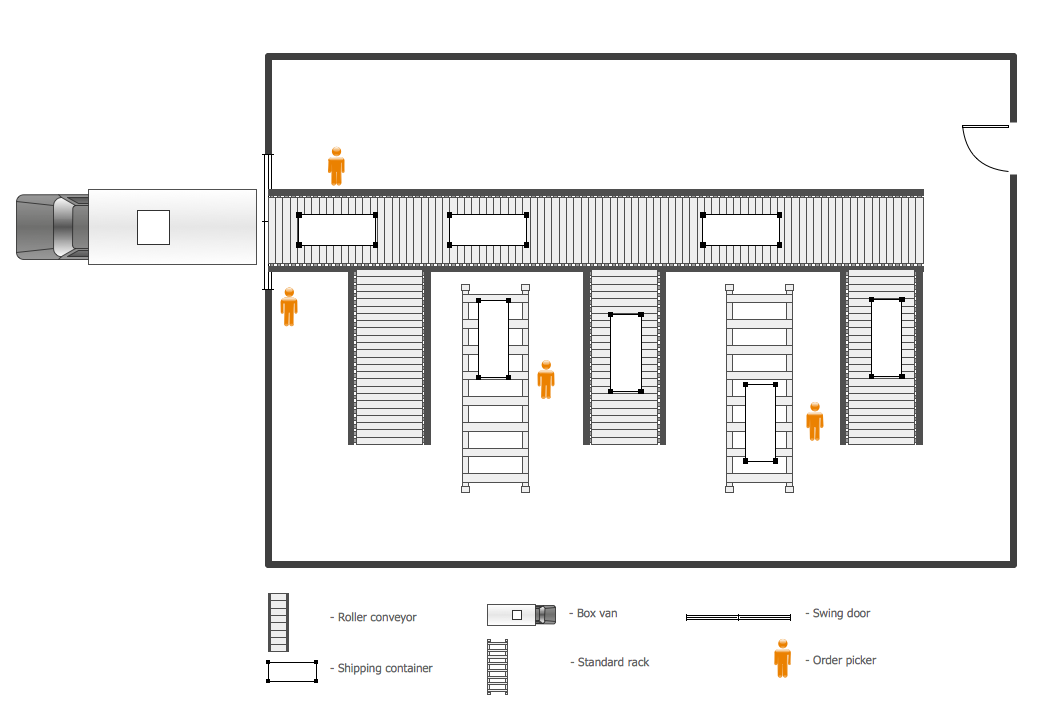
Plant Layout Plans solution can be used for power plant design and plant layout design, for making the needed building plant plans and plant layouts looking professionally good. Having the newest plant layout software, the plant design solutions and in particular the ConceptDraw’s Plant Layout Plans solution, including the pre-made templates, examples of the plant layout plans, and the stencil libraries with the design elements, the architects, electricians, interior designers, builders, telecommunications managers, plant design engineers, and other technicians can use them to create the professionally looking drawings within only a few minutes.
CAD Drawing Software for Making Mechanic Diagram and Electrical Diagram Architectural Designs
Computer-aided design (CAD) is an automated organizational-technical system that implements the information technology of execution the functions of design. It consists of staff and complex of technical, software and other means of automation designing process. CAD is used for improvement design quality and designer's productivity. Computer-aided design is actively applied in many fields, such as industrial and mechanical design, automotive, aerospace, and shipbuilding industries, in designing electrical diagrams for electronic systems and architectural design, in manufacturing for creation the databases. СonceptDraw DIAGRAM is a powerful and effective CAD drawing software for making Mechanic Diagram and Electrical Diagram Architectural Designs. CAD diagrams and designs of any complexity created with ConceptDraw DIAGRAM are vector graphic documents, which can be easy converted to a variety of formats (image, HTML, PDF file, MS PowerPoint Presentation, Adobe Flash or MS Visio XML) for further successful using in presentations and reports.
Building Plan Software. Building Plan Examples
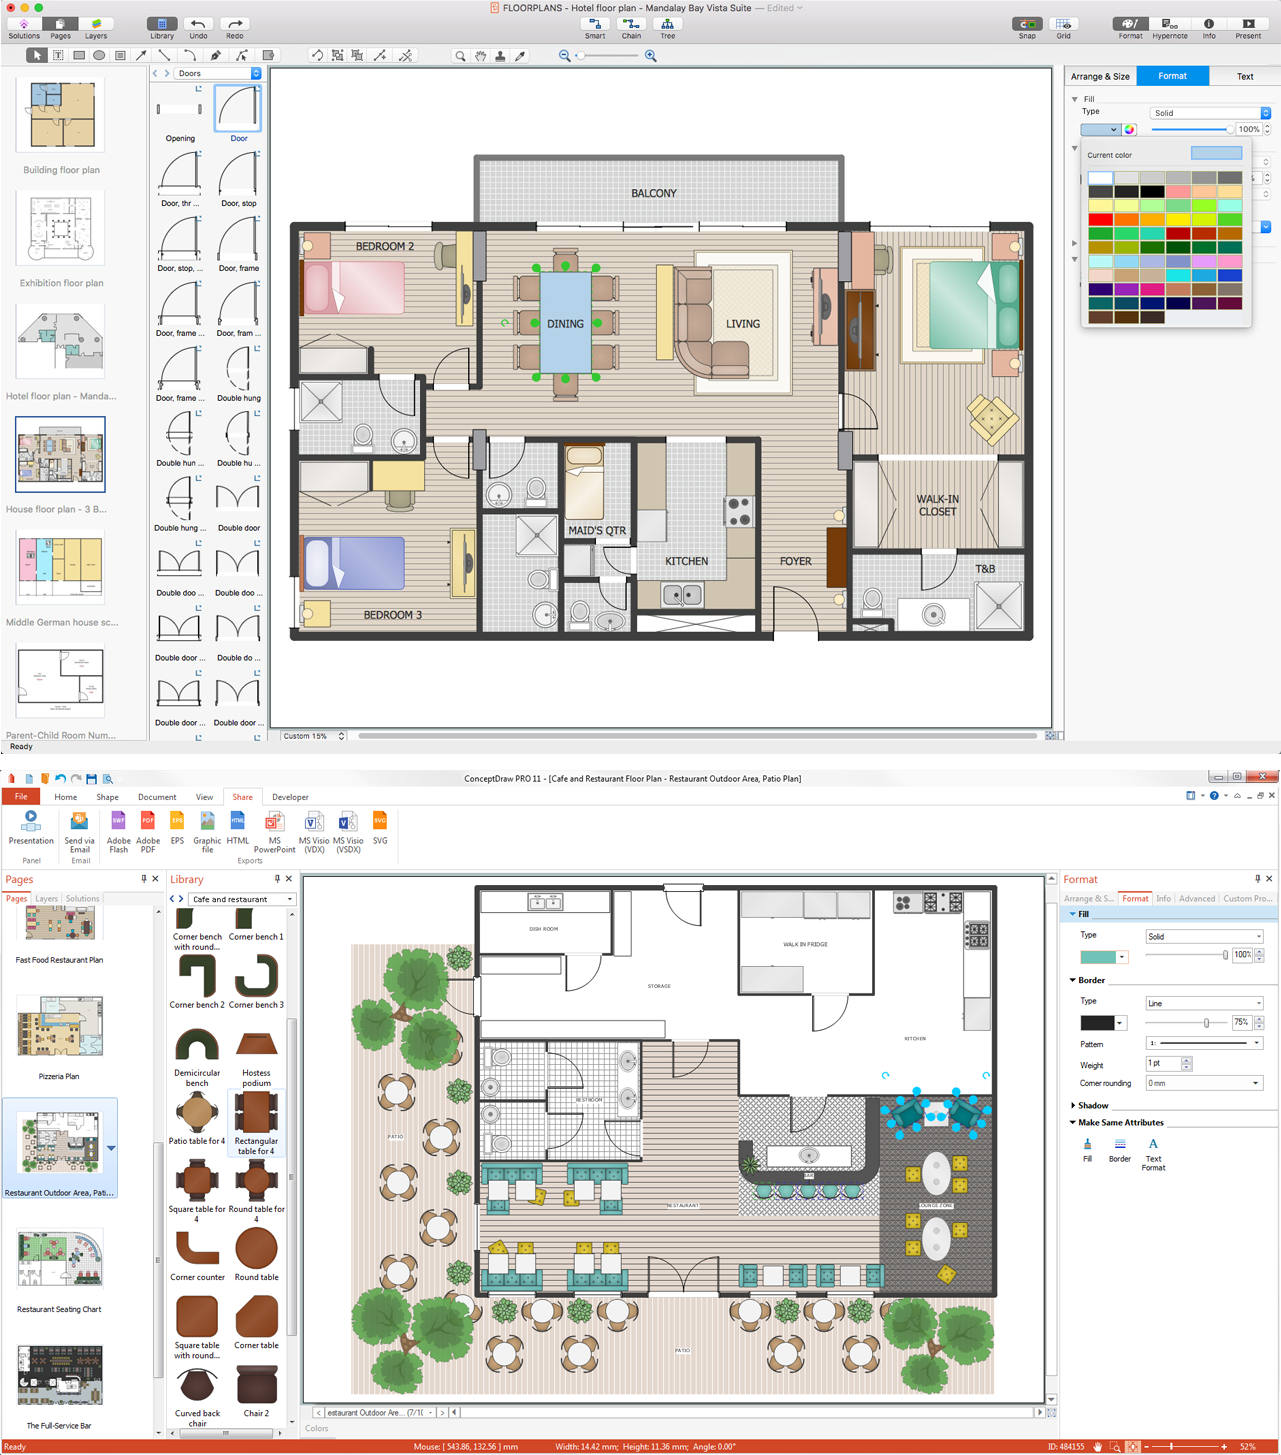
The correct implementation of large and complex construction projects is not possible without a well developed building concept and architectural project, which includes a huge spectrum of different plans and technical drawings. The obligatory package of plans typically contains a general plan of a building, detailed floor plans, ceiling and lighting plans, plans of furniture placement, etc. These plans effectively visualize all aspects of a building and its surrounding area. ConceptDraw DIAGRAM is a powerful building plans design software, which provides the Building Plans area including 17 solutions useful for architects, designers, builders, and other people tightly related with a building process: Basic Floor Plans, Floor Plans, Electric and Telecom Plans, Fire and Emergency Plans, Plant Layout Plans, Security and Access Plans, Plumbing and Piping Plans, Reflected Ceiling Plans, HVAC Plans, Cafe Restaurant Plans, Gym and SPA Plans, Landscape & Garden, Office Layout Plans, School and Training Plans, Seating Plans, Site Plans, Sport Field Plans.
 Plumbing and Piping Plans
Plumbing and Piping Plans solution extends ConceptDraw DIAGRAM.2.2 software with samples, templates and libraries of pipes, plumbing, and valves design elements for developing of water and plumbing systems, and for drawing Plumbing plan, Piping plan, PVC Pipe plan, PVC Pipe furniture plan, Plumbing layout plan, Plumbing floor plan, Half pipe plans, Pipe bender plans.
Chart Audits. Chart Auditor
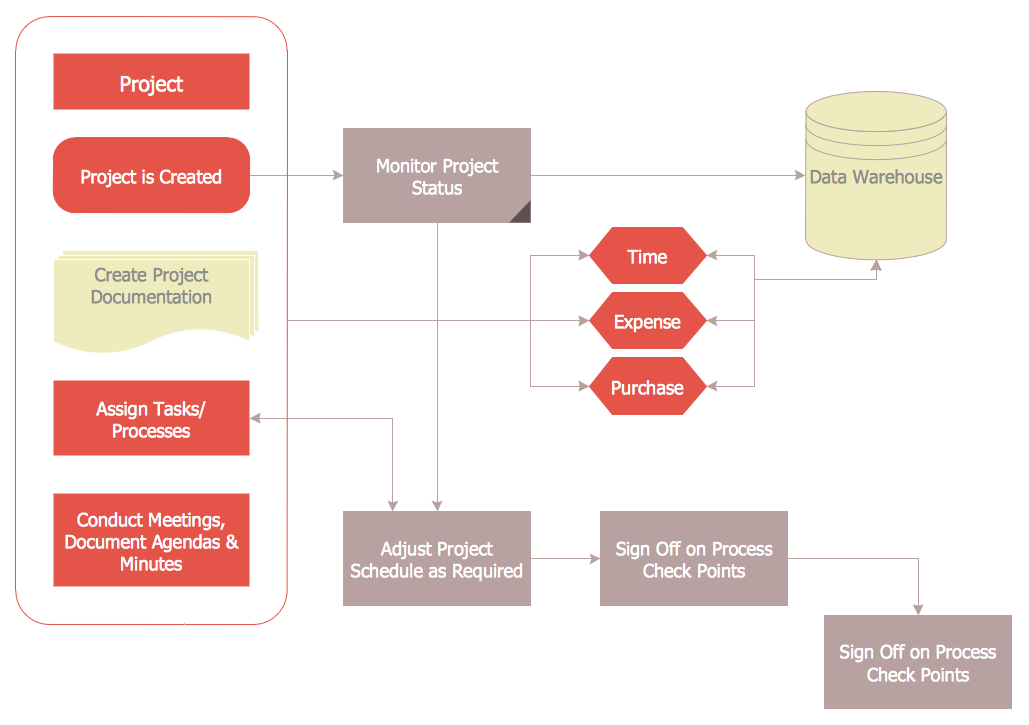
Chart Audits, Chart Auditor - Designing the chart auditor can use the audit flowchart symbols from the Audit Flowcharts library for Audit Flowcharts Solution. Moreover it is convenient to use anyone of samples or templates offered by Audit Flowcharts Solution and design its own chart audits and audit flowcharts on the base of them.
 Health Food
The Health Food solution contains the set of professionally designed samples and large collection of vector graphic libraries of healthy foods symbols of fruits, vegetables, herbs, nuts, beans, seafood, meat, dairy foods, drinks, which give powerful possi
Plant Design
ConceptDraw DIAGRAM extended with Plant Layout Plans Solution from the Building Plans Area is a modern full-featured Plant Design software.
 Cooking Recipes
Create quick and easy recipe diagrams with the Cooking Recipes solution. Make a tasty meal for dinner, for holidays, or for a party.
- Example For Basement Parking
- Site Plans | Building Drawing Design Element Site Plan | Interior ...
- Site Plan Basement Parking
- Basement Parking Drawings For Hotels
- Reflected Ceiling Plan
- Plant Layout Plans | How to Create a Plant Layout Design | Plant ...
- Plumbing and Piping Plans | Design elements - Bathroom | Design ...
- Gym layout plan
- Warehouse layout floor plan | Warehouse with conveyor system ...
- How To Draw Building Plans | Transport map - Vector stencils library ...


