How to Draw Pictorial Chart. How to Use Infograms
How to draw pictorial chart quick, easy and effective? ConceptDraw PRO offers the unique Pictorial Infographics Solution that will help you! Pictorial Infographics solution contains large number of libraries with variety of predesigned vector pictograms that allows you design infographics in minutes. There are available 10 libraries with 197 vector pictograms.Sample Pictorial Chart. Sample Infographics
Sample Pictorial Chart - Pictorial Infographics solution provides easy-to-use design infographics drawing tools, large collection of different sample infographics and infograms, sample pictorial chart and templates to be filled in, and 10 libraries with great quantity of predesigned vector pictograms. Use Pictorial Infographics solution to draw your own design pictorial infographics documents quick and easy.Sport pictograms. Olympic Games
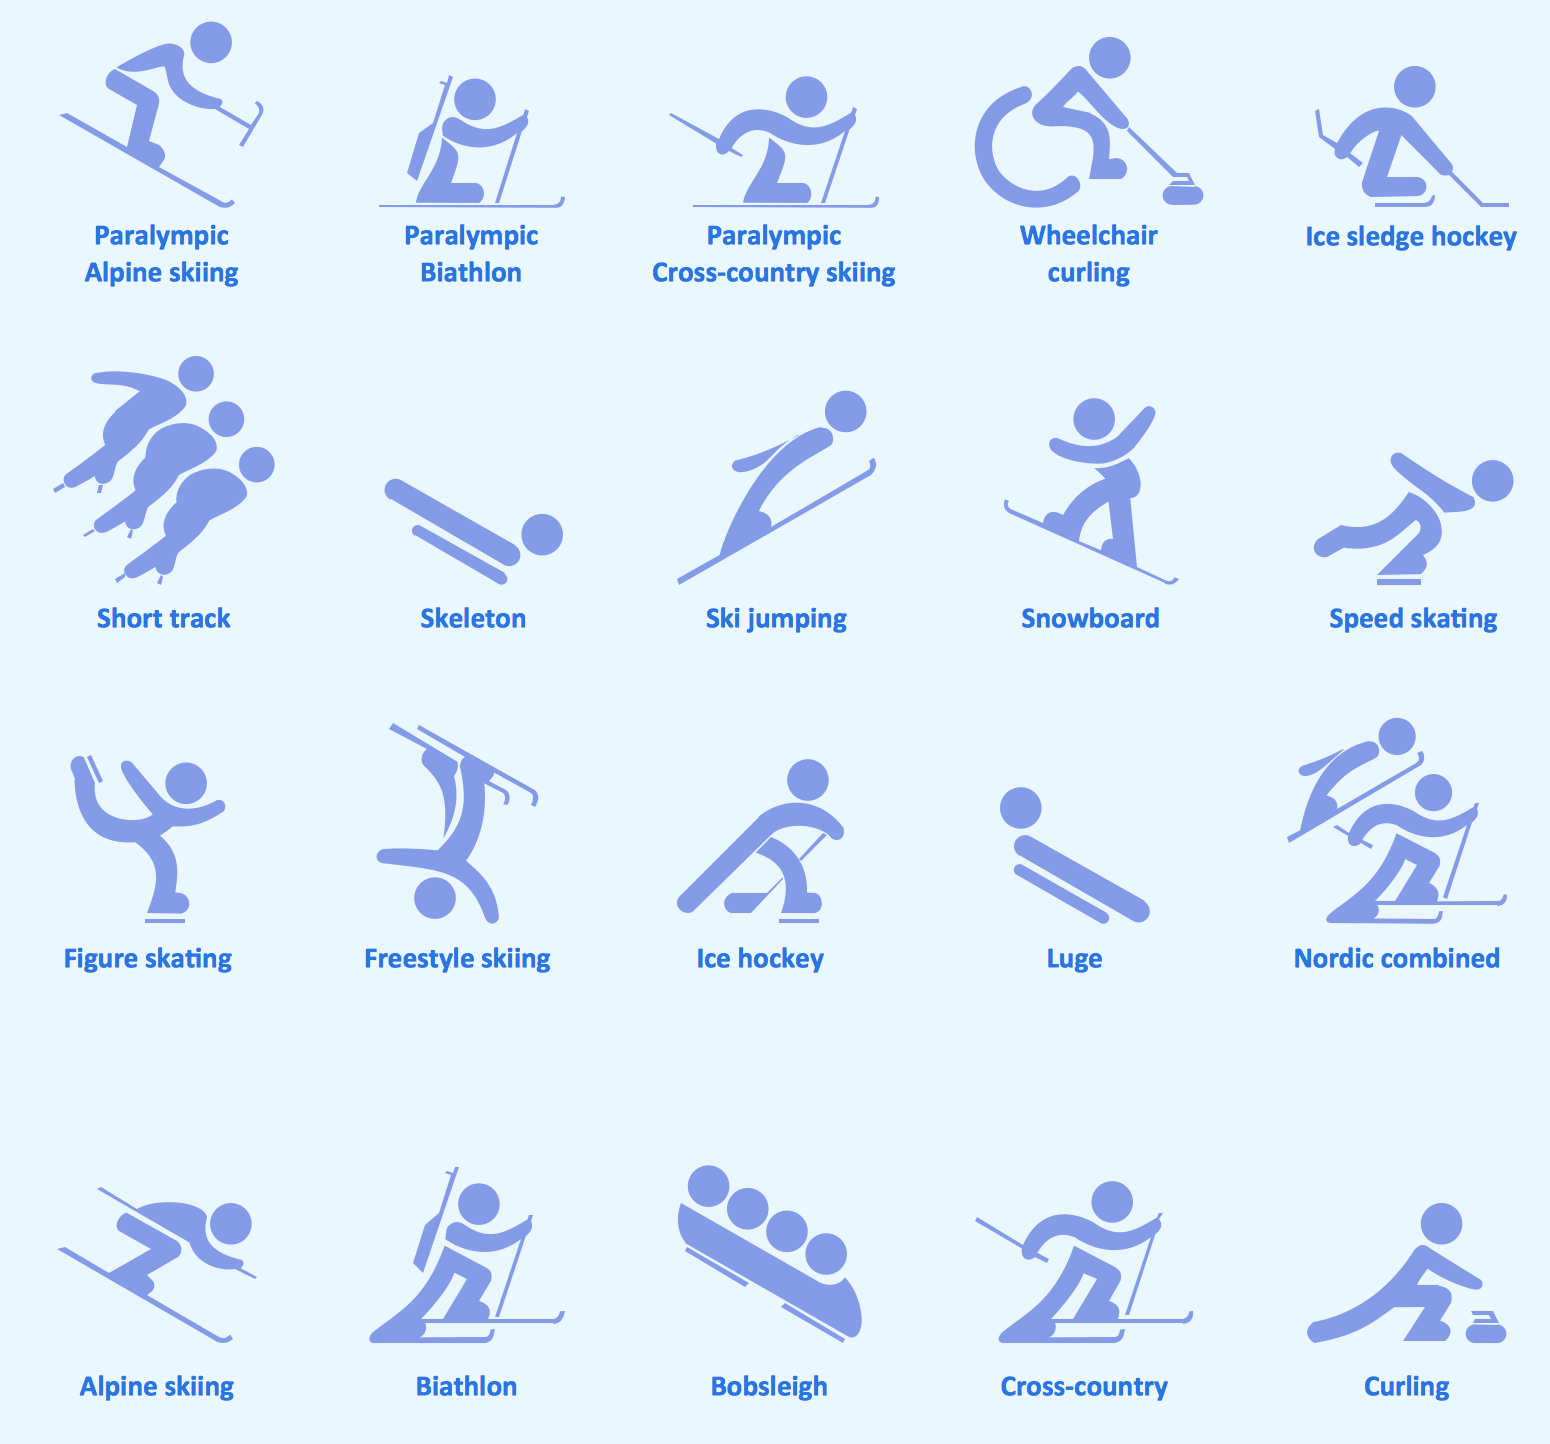
The Winter Sports solution from Sport Area of ConceptDraw Solution Park contains winter sports pictograms you may use illustrating any kind of material about Olympic Games or any other sport competitions.Basic Diagramming
Create flowcharts, organizational charts, bar charts, line graphs, and more with ConceptDraw PRO.
Workflow Flowchart Symbols
The Workflow diagrams are the specialized type of flowcharts which allow to visualize any sorts of step-by-step processes. They are usually created as flowcharts, with objects that represent in a simple visual manner the steps in the process connected by arrows that indicate the next step. The ability easily create Workflow diagrams visually describing the tasks, documents associated with the tasks, people which are responsible for execution at each stage of workflow is made possible with Workflow Diagrams solution. This solution extends ConceptDraw PRO with a Workflow Diagram library that contains large collection of predesigned workflow flowchart symbols.Healthy Foods
Use of various charts, diagrams and infographics is the most effective way of visual presenting information about healthy foods, healthy eating and healthy diet. ConceptDraw PRO diagramming and vector drawing software offers the Health Food solution from the Food and Beverage area of ConceptDraw Solution Park which is overfull of powerful drawing tools, libraries with ready-to-use vector objects and clipart, predesigned samples and examples which will help you easy design healthy foods illustrations.
 Area Charts
Area Charts are used to display the cumulative totals over time using numbers or percentages; or to show trends over time among related attributes. The Area Chart is effective when comparing two or more quantities. Each series of data is typically represented with a different color, the use of color transparency in an object’s transparency shows overlapped areas and smaller areas hidden behind larger areas.
 Project Management Area
Project Management area provides Toolbox solutions to support solving issues related to planning, tracking, milestones, events, resource usage, and other typical project management functions.
- Basic Flowchart Symbols and Meaning | Design Pictorial ...
- Basic Flowchart Symbols and Meaning | Road Transport - Design ...
- Biology Drawing Software | Basic Flowchart Symbols and Meaning ...
- UML Class Diagram Example - Medical Shop | Basic Flowchart ...
- Basic Flowchart Symbols and Meaning | Flow chart Example ...
- Design Pictorial Infographics. Design Infographics | UML Class ...
- Road Transport - Design Elements | Basic Flowchart Symbols and ...
- Design Pictorial Infographics. Design Infographics | PM ...
- Design Pictorial Infographics. Design Infographics | How to Draw ...
- Process Flowchart | Cab booking public process - Collaboration ...
- Design Pictorial Infographics. Design Infographics | UML Class ...
- Process Flowchart | Design Pictorial Infographics. Design ...
- How to Create Management Infographics Using ConceptDraw PRO ...
- Presenting Documents with Remote Presentation for Skype Solution ...
- Office pictograms - Vector stencils library | Design Pictorial ...
- Types of Flowcharts | Design Pictorial Infographics. Design ...
- Office pictograms - Vector stencils library | Design Pictorial ...
- Design Pictorial Infographics. Design Infographics | Design ...
- Office pictograms - Vector stencils library | Design elements - Office ...
- How to Create Flowcharts for an Accounting Information System ...


