HelpDesk
How to Start Drawing a Diagram on Mac
In this tutorial we will explain how to create a simple chart in ConceptDraw DIAGRAM using a template, and how to use the library objects.Bubble diagrams in Landscape Design with ConceptDraw DIAGRAM
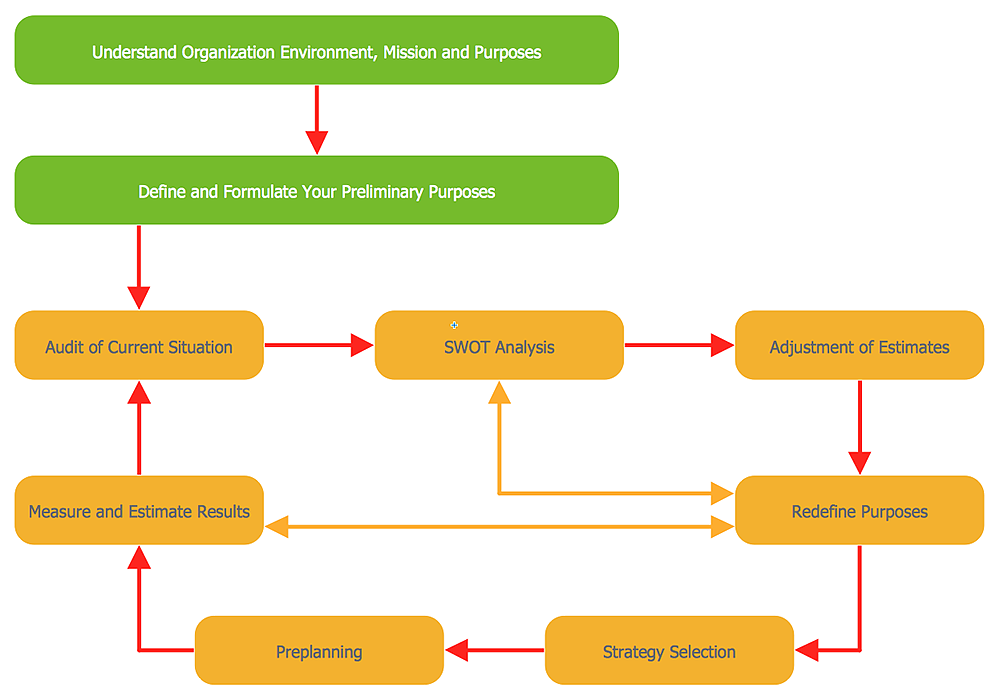
Bubble Diagrams are the charts with a bubble presentation of data with obligatory consideration of bubble's sizes. They are analogs of Mind Maps and find their application at many fields, and even in landscape design. At this case the bubbles are applied to illustrate the arrangement of different areas of future landscape design, such as lawns, flowerbeds, playgrounds, pools, recreation areas, etc. Bubble Diagram helps to see instantly the whole project, it is easy for design and quite informative, in most cases it reflects all needed information. Often Bubble Diagram is used as a draft for the future landscape project, on the first stage of its design, and in case of approval of chosen design concept is created advanced detailed landscape plan with specification of plants and used materials. Creation of Bubble Diagrams for landscape in ConceptDraw DIAGRAM software is an easy task thanks to the Bubble Diagrams solution from "Diagrams" area. You can use the ready scanned location plan as the base or create it easy using the special ConceptDraw libraries and templates.Cross-Functional Flowchart Basics
Don't let your first glance fool you. ConceptDraw is a lot easier to use than it looks. Use its cross-functional templates and library as basics to get started. All you need to know are a few basic steps and terms. ConceptDraw Arrows10 Technology is a new age in drawing software. Use it for process flows and its new rapid draw feature enables to draw an impressive charts in a seconds.HelpDesk
How to Simplify Flow Charting on PC
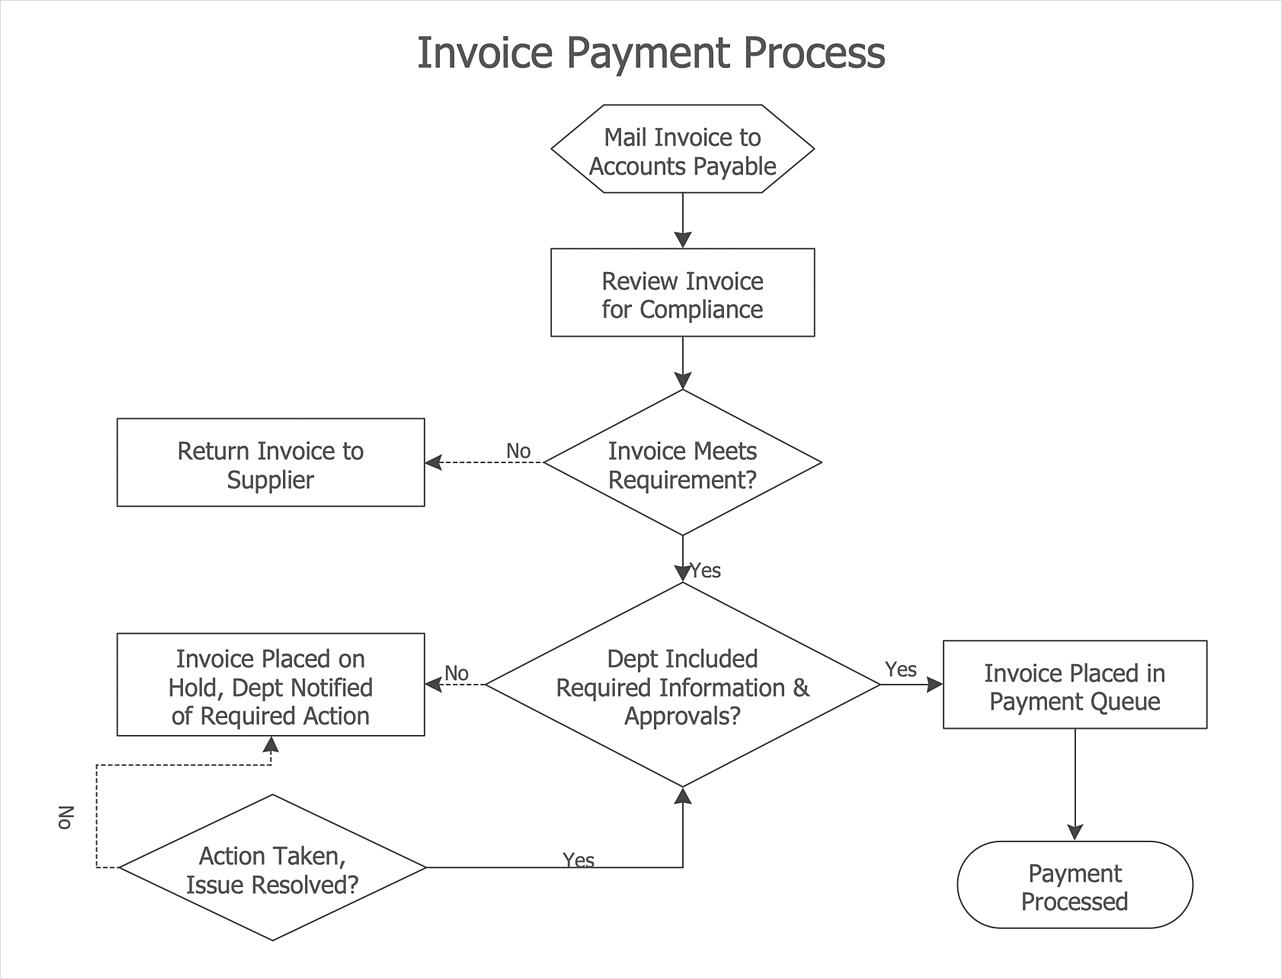
Flowcharts are the best tool for staking out a huge and complex process into some small readable parts. The use of standard symbols that make it clear for a wide audience makes a software tool preferred for this task. The core of a successful flowchart is its simplicity. That is why often before beginning making flowchart through software, people draw the sketch on a piece of paper. Designing an effective flowchart means the combination of the data needed to be shown and the simplicity with which you depict it. In ConceptDraw DIAGRAM it really is so simple to draw even the most complex flowcharts. Use Rapid Draw technology for the best results.HelpDesk
How to Draw a Pareto Chart
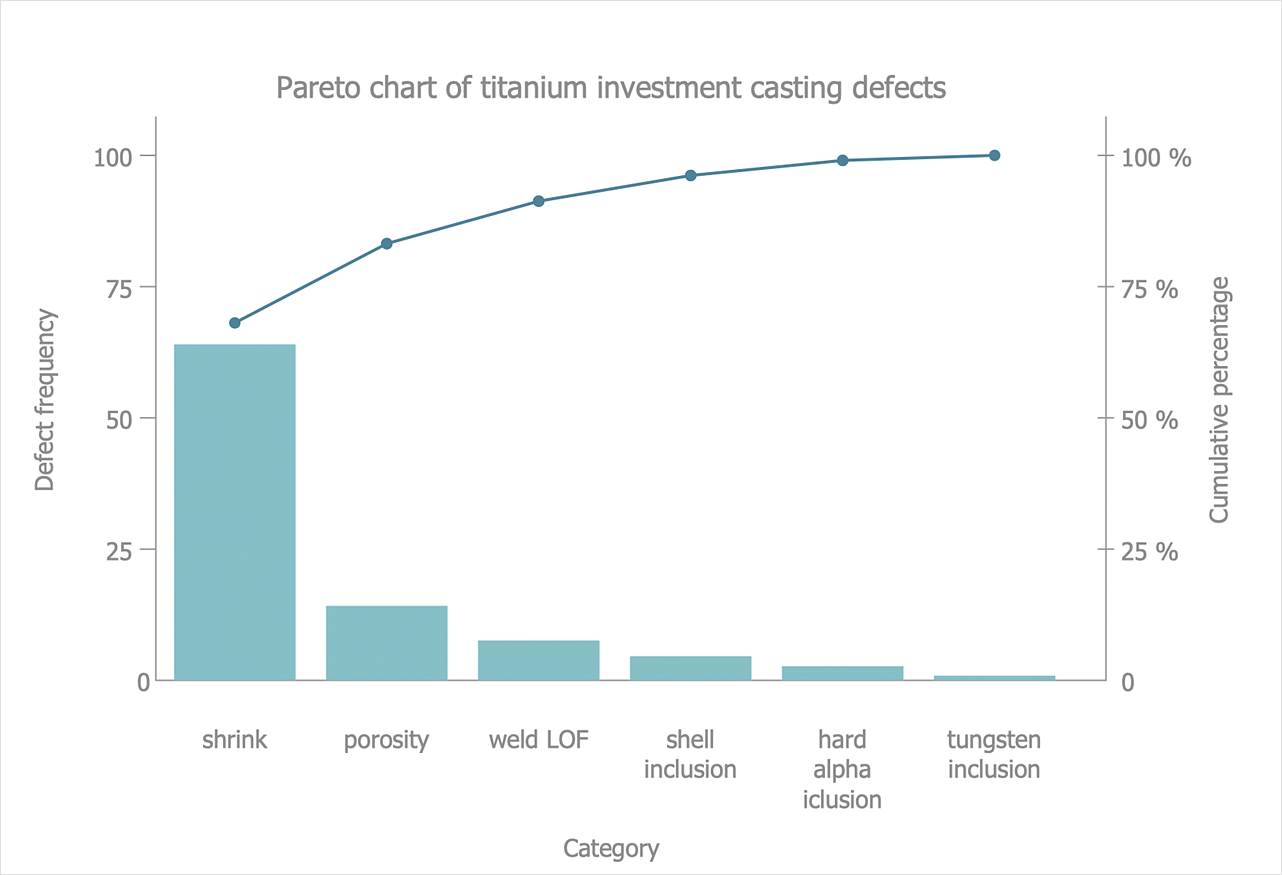
The Seven Basic Tools of Quality were picked as effective visual tool-set for identifying the root cause of quality-related problems within the workplace. Seven Basic Tools of Quality comprise of seven diagrams that are diverse enough to be used to any business troubleshooting scenario, but simple enough that employees of all types can understand and apply them. One of these tools is a Pareto chart. It combines both a line graph and a bar chart, where the bar chart displays data values, and a line represents a total value. Pareto chart is used for quality control to identify the source of the quality problem. ConceptDraw Seven Basic Tools of Quality solution delivers a big set of vector stencil libraries and samples for each quality control diagram, including a Pareto chart.HelpDesk
How to Simplify Flow Charting on Mac
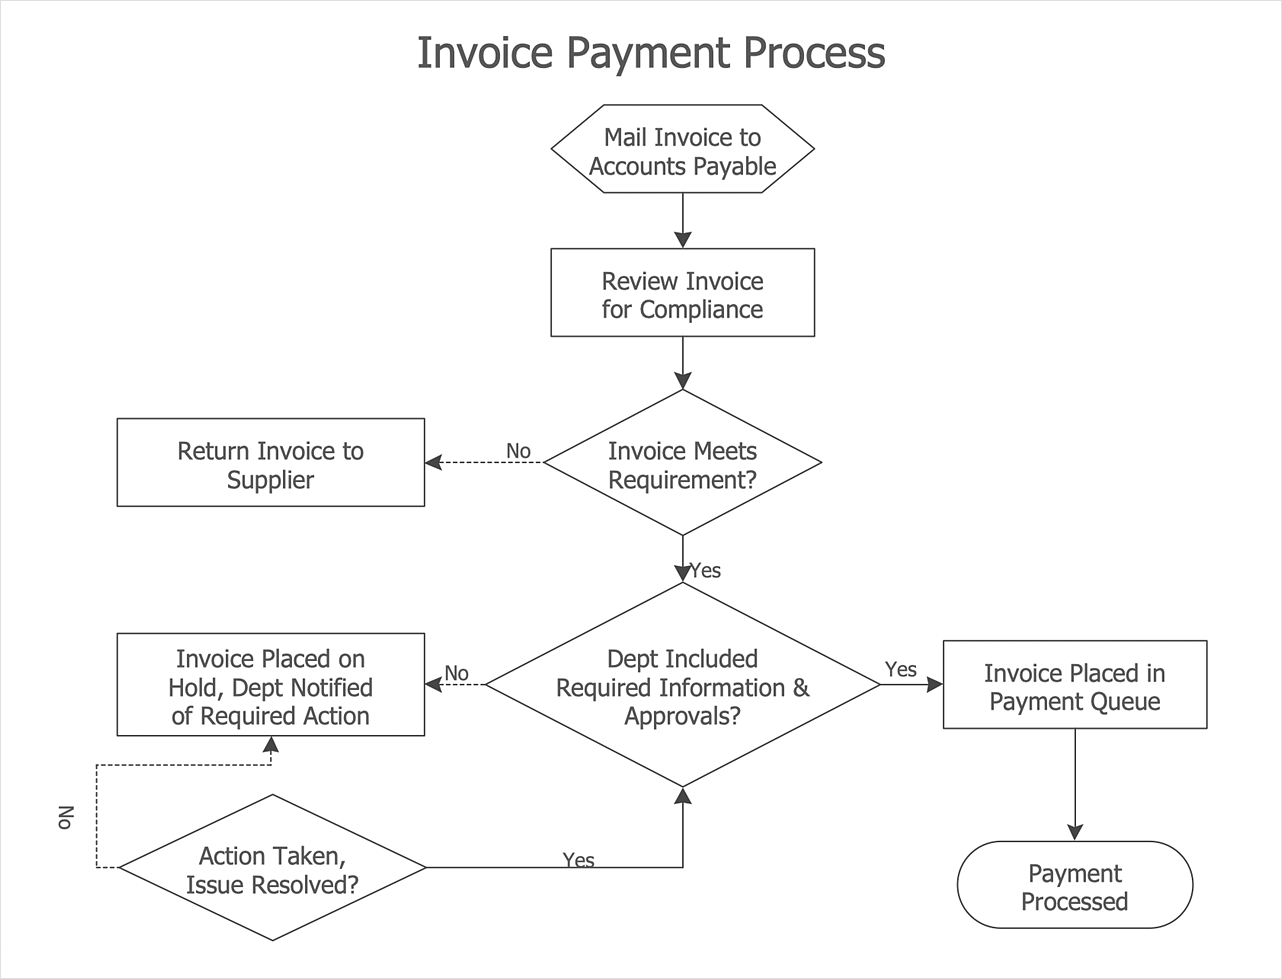
A flowchart is a great way to present any complex process in a simple to understand manner. A flowchart is perhaps the most common form of diagrams used in both technical and social fields. Since a flowchart is a method that allows describing visually any consequent process, it can be used to show the flow of logic of any process. In ConceptDraw DIAGRAM it really is simple to draw even the most complex flowcharts. Use RapidDraw technology for the best results.- How To use Landscape Design Software | Process Flowchart ...
- How To use Landscape Design Software | ConceptDraw PRO: Able ...
- Bubble diagrams in Landscape Design with ConceptDraw PRO ...
- Basic Landscape Design Concepts
- Bubble diagrams in Landscape Design with ConceptDraw PRO ...
- ConceptDraw PRO The best Business Drawing Software | Simple ...
- Bubble diagrams in Landscape Design with ConceptDraw PRO ...
- Landscape Architecture with ConceptDraw PRO | How To use ...
- How to Draw a Natural Landscape | How to Design a Good ...
- Bubble diagrams in Landscape Design with ConceptDraw PRO ...
- How To use Landscape Design Software | Landscape Architecture ...
- How To use Landscape Design Software | Bubble diagrams in ...
- How To use Landscape Design Software | Landscape Plan | How to ...
- Design elements - Transparent trees | How To use Landscape ...
- Landscape Design Tools
- How To use Landscape Design Software | Bubble diagrams in ...
- How To Design A Landscape
- Basic Flowchart Symbols and Meaning | Entity Relationship ...
- How To use Landscape Design Software | Landscape Plan | How To ...
- Simple Landscape Plan


