 Fishbone Diagrams
The Fishbone Diagrams solution extends ConceptDraw PRO v10 software with the ability to easily draw the Fishbone Diagrams (Ishikawa Diagrams) to clearly see the cause and effect analysis and also problem solving. The vector graphic diagrams produced using this solution can be used in whitepapers, presentations, datasheets, posters, and published technical material.
 What is a Diagram Area
Solutions of the area What is a Diagram from ConceptDraw Solution Park collect templates, samples and vector stencils libraries for drawing diagrams visualizing qualitative information and knowledge.
HelpDesk
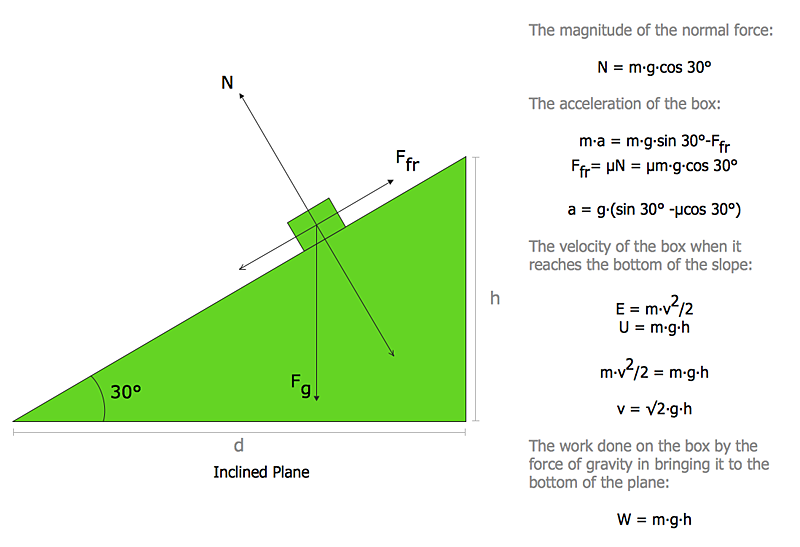
How to Draw Physics Diagrams in ConceptDraw PRO
Nothing is more helpful in the study of physics as a visual representation of the physical processes: physics schemes, diagrams and illustrations. Physics charts can be helpful when you learn Physics, perform experiments, or solve any other tasks regarding Physics. ConceptDraw PRO allows you to draw physical diagrams of mechanical, nuclear, optical and electrical processes using the set of vector physics symbols and physics diagram templates.
 Education Package
Education Package is a comprehensive set of multifarious graphical solutions from ConceptDraw Solution Park, collected together in help to ConceptDraw PRO users working in a field of science, education and training, which is aimed at improving the quality of education and helping to design with ease variety of interesting and colorful educational materials, diagrams, charts and maps. Use it to present the information and knowledge in an interesting, clear, structured and simple form to achieve a success in education and pedagogy, to maintain the interest of students and pupils throughout the whole learning process, at the lectures, lessons and even during independent work with additional materials, to contribute to better perception of scientific information by listeners during the conferences and reports.
 Sales Flowcharts
The Sales Flowcharts solution lets you create and display sales process maps, sales process workflows, sales steps, the sales process, and anything else involving sales process management.
 Computer and Networks Area
The solutions from Computer and Networks Area of ConceptDraw Solution Park collect samples, templates and vector stencils libraries for drawing computer and network diagrams, schemes and technical drawings.
- Science Practical Diagrams
- Chemistry Chart Practical Diagram
- How To Draw A Vector Diagram Engineering Science
- Chemistry Practical Diagrams
- Physics Diagrams | Basic Audit Flowchart. Flowchart Examples ...
- Basic Flowchart Symbols and Meaning | Diagram Flow Chart | Data ...
- Basic CCTV System Diagram . CCTV Network Diagram Example ...
- Schematic Science Such As Flow Charts Etc
- Physics Practical Diagram
- Venn Diagram Examples for Problem Solving. Computer Science ...
- List Chemistry Practical Apparatus And Their Diagram And Uses
- Process Flowchart | Basic Flowchart Symbols and Meaning | Venn ...
- Chemistry Equation Symbols | Basic Network Diagram | Scientific ...
- Basic Flowchart Symbols and Meaning | Flowchart of Products ...
- Basic Flowchart Symbols and Meaning | Diagram Flow Chart | Venn ...
- The Reed-Kellogg system - Basic schemata | Free Sentence ...
- Diagram Of Chemistry Practical Apparatus
- Diagram of a Basic Computer Network. Computer Network Diagram
- Scientific Method Flow Chart Graphics
- Basic Flowchart Symbols and Meaning | Basic Diagramming | Types ...
