Basketball Illustrations
It’s very important that your basketball illustrations looked bright, beautiful, interesting and attracted the attention. For this you just need to add the illustrations! The Basketball solution delivers two libraries with predesigned vector clipart objects. Simply drag the needed clipart to your diagram to make it successful.Basketball Plays Software
Basketball is a popular sport played by two teams of five players with a ball. The game takes place on a rectangular court. The team goal is to score a ball into the basket of the opponent team. The team with the most points wins the game. ConceptDraw PRO diagramming and vector drawing software extended with Basketball solution from the Sport area of ConceptDraw Solution Park is a very useful tool for designing the basketball-related diagrams of any complexity.Basketball Court Dimensions
Basketball is team play with a ball a special court. The goal is to throw a ball into one of the baskets, which are mounted to a backboard at a certain height on the edges of the court.Basketball Field in the Vector
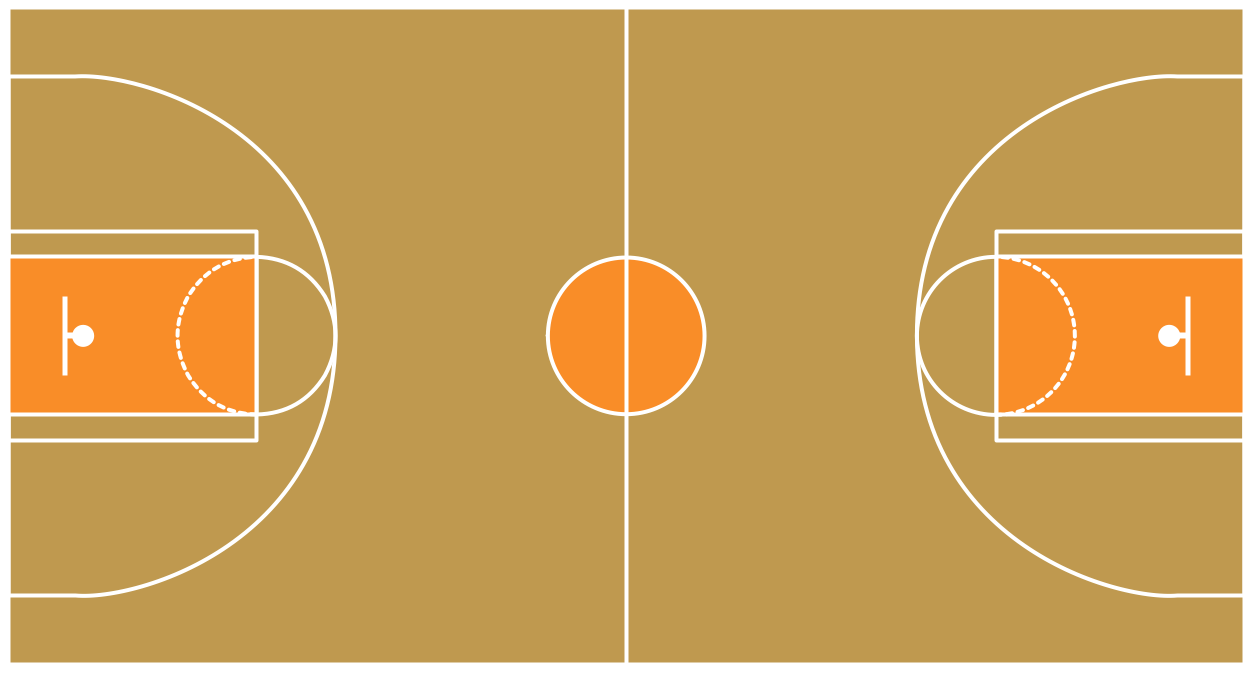
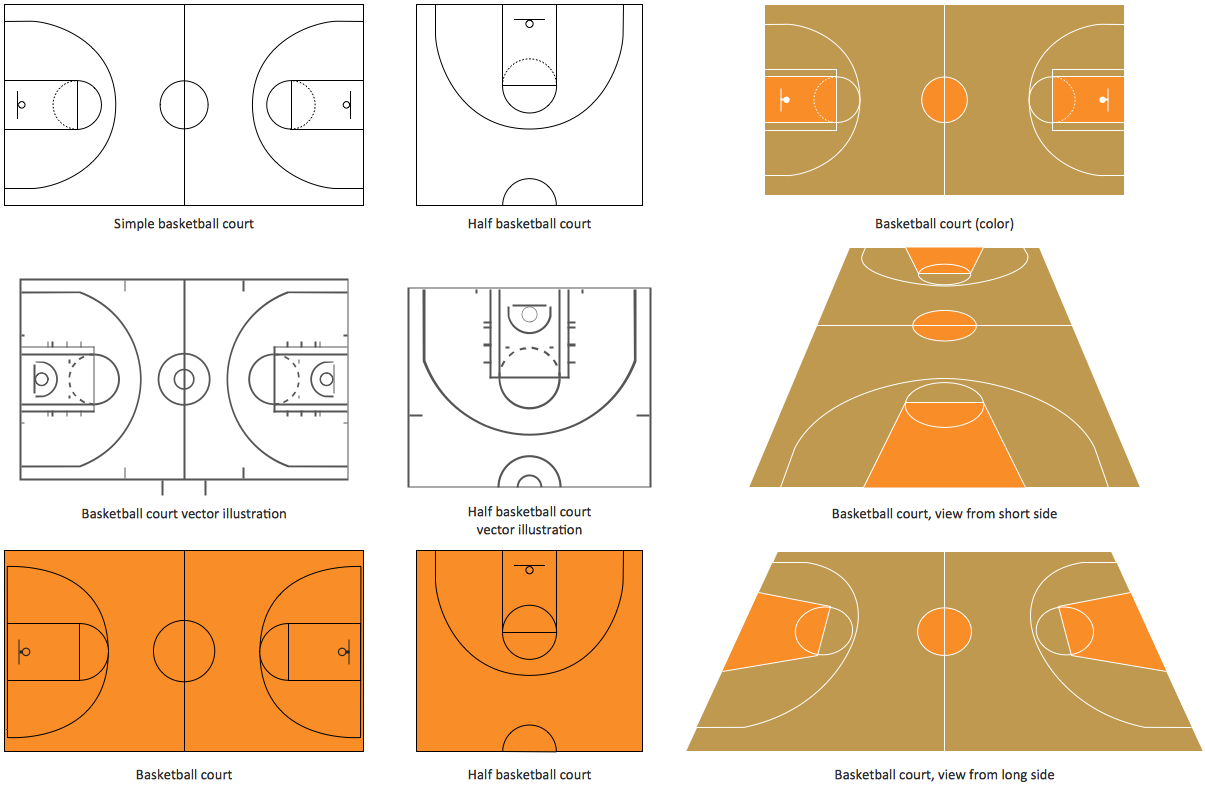
The Basketball Field library from the Basketball solution provides a complete set of ready-to-use predesigned vector courts: horizontally and vertically located, whole and half of court, colored and not, courts with views from different sides. All courts objects are designed according to the real basketball courts dimensions. Simply drop the needed basketball field in the vector from the library to design your own basketball diagram.
 Basketball
The Basketball Solution extends ConceptDraw PRO v9.5 (or later) software with samples, templates, and libraries of vector objects for drawing basketball diagrams, plays schemas, and illustrations. It can be used to make professional looking documents, pre
Basketball Court Diagram and Basketball Positions
ConceptDraw PRO software extended with the Basketball solution from the Sport area of ConceptDraw Solution Park provides libraries, templates and samples allowing basketball specialists and fans to draw the professional looking diagrams and schemas of any complexity in a few minutes. It’s very convenient way to explain the different basketball tactics, positions and rules using the visual illustrations.Soccer (Football) Illustrated
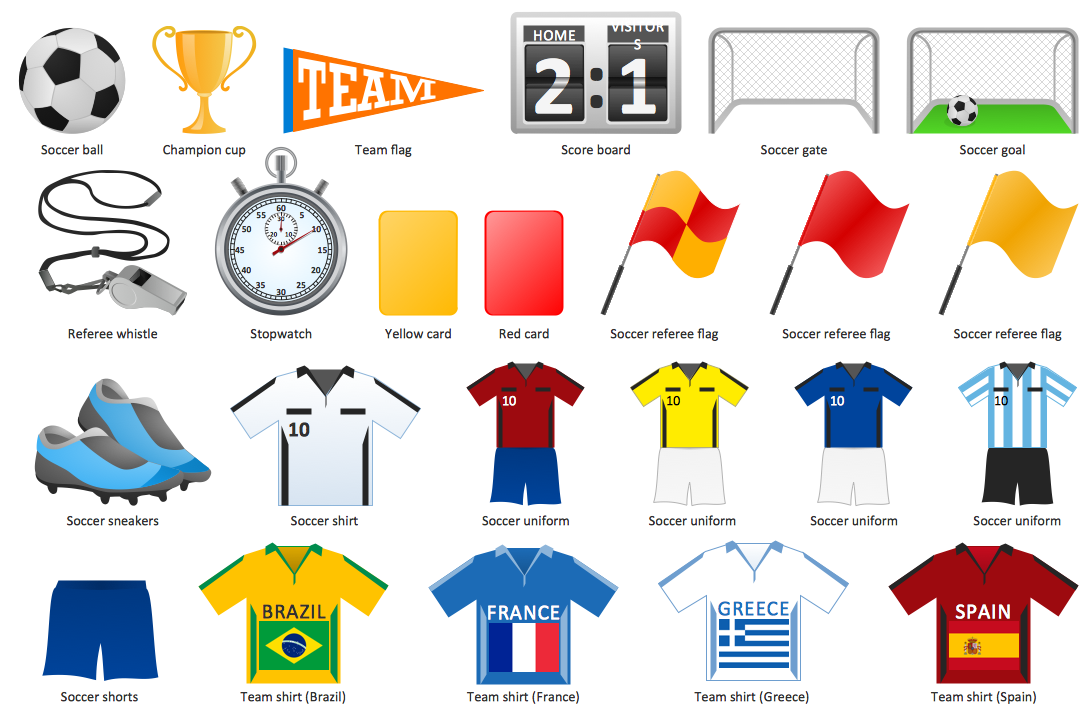
It’s very important that your soccer drawing looked beautiful, interesting and attracted the attention. For this it is necessary add the illustrations! The Soccer solution delivers several libraries with predesigned bright and interesting clipart objectsHelpDesk
How to Save a Drawing as a Graphic File in ConceptDraw PRO
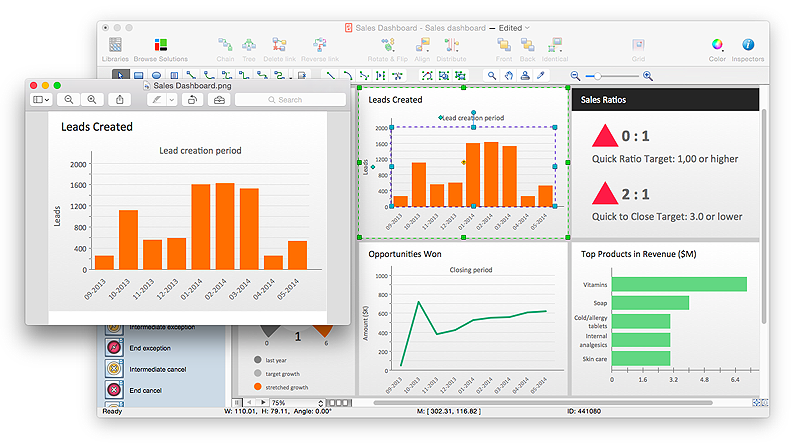
ConceptDraw PRO can save your drawings and diagrams in a number of highly useful formats, including graphic files. You can save your drawing as a .PNG, .JPG, or other graphic format file.
 HVAC Plans
Use HVAC Plans solution to create professional, clear and vivid HVAC-systems design plans, which represent effectively your HVAC marketing plan ideas, develop plans for modern ventilation units, central air heaters, to display the refrigeration systems for automated buildings control, environmental control, and energy systems.
 Sport Field Plans
Construction of sport complex, playgrounds, sport school, sport grounds and fields assumes creation clear plans, layouts, or sketches. In many cases you need represent on the plan multitude of details, including dimensions, placement of bleachers, lighting, considering important sport aspects and other special things.
Flow Chart for Olympic Sports
Sports Selection Flow Chart - This sample was created in ConceptDraw PRO using the Flowcharts Solution from the Marketing Area and shows the Flow Chart of sport selection. An experienced user spent 10 minutes creating this sample.
 Entity-Relationship Diagram (ERD)
An Entity-Relationship Diagram (ERD) is a visual presentation of entities and relationships. That type of diagrams is often used in the semi-structured or unstructured data in databases and information systems. At first glance ERD is similar to a flowch
HelpDesk
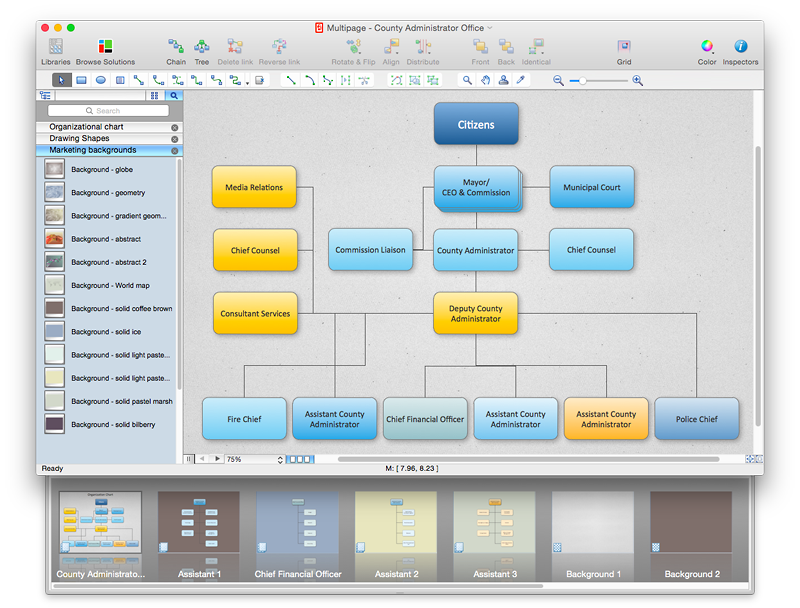
How to Add Different Backgrounds Within a Multipage Drawing
Tips on how to add different backgrounds within single ConceptDraw documentHelpDesk
How to Create Management Infographics Using ConceptDraw PRO
Management might want to communicate a basic workflow for each division of the company, visualise business strategy and decision processes, or display a certain business training concept. In this case, an infographic can be more text heavy, and use illustrations to establish a timeline, process, or step-by-step sequence of events.ConceptDraw PRO can be used as a tool for creating management infographics. It allows you to draw infographics quickly and easily using the special templates and vector stencils libraries. Infographics can be used to quickly communicate a message, to simplify the presentation of large amounts of data, to see data patterns and relationships, and to monitor changes in variables over time. It can contain bar graphs, pie charts, histograms, line charts, e.t.c.
- Basketball Court Image Pdf
- Pdf Court Of Basketball
- Images Of Basketball Court
- Basketball Court Dimensions In Meters Pdf
- Dimension Of Basketball Court Pdf
- Basketball Field in the Vector | Soccer (Football) Dimensions ...
- Playground Dimensions Pdf
- Basketball Court Dimensions | Basketball | Soccer (Football ...
- Basketball Court Diagram and Basketball Positions | Basketball ...
- Basketball Court Dimensions | Basketball Court Diagram and ...
- Football | Basketball Illustrations | Soccer (Football) Diagram ...
- Basketball | Basketball Court Dimensions | Basketball Court ...
- Basic Flowchart Images . Flowchart Examples | Manufacturing and ...
- Basketball court | Interior Design Sport Fields - Design Elements ...
- Basketball Court Diagram and Basketball Positions | How to Make a ...
- Soccer (Football) Diagram Software | Basketball Court Dimensions ...
- Metropolitan area networks (MAN). Computer and Network Examples
- How To Draw Building Plans | How To Create Restaurant Floor Plan ...
- Beautiful Nature Scene: Drawing | Drawing Illustration | How to ...
- Flow Chart Symbols | How To Create a FlowChart using ...


