 Basketball
The Basketball Solution extends ConceptDraw PRO v9.5 (or later) software with samples, templates, and libraries of vector objects for drawing basketball diagrams, plays schemas, and illustrations. It can be used to make professional looking documents, pre
HelpDesk
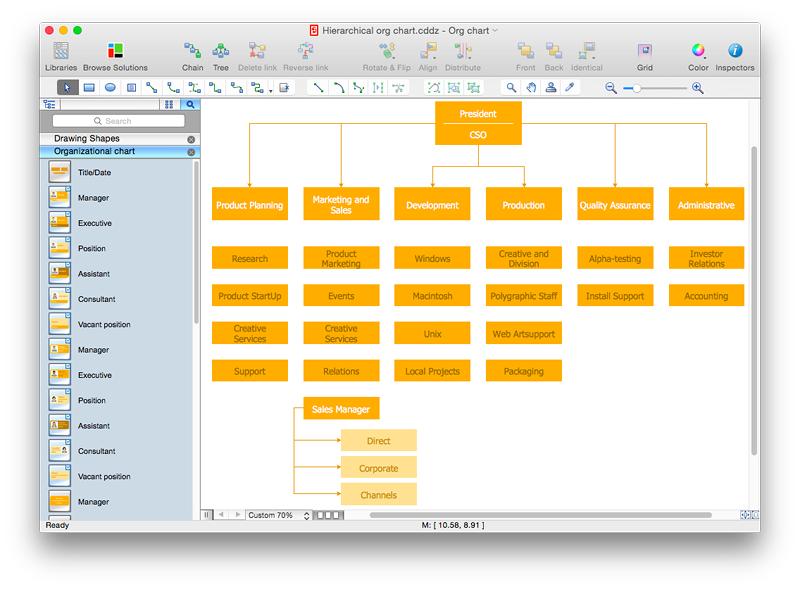
How to Draw a Hierarchical Organizational Chart with ConceptDraw PRO
There are a number of different organisational structures. The most appropriate structure will depend on the size of the business and the type of business. A hierarchical organizational structure is one of the most typical organizational structure. This structure can be represented as a pyramid, with a single entity in authority at the top, with subsequent levels of power beneath them. Each member of the pyramid reports only to their direct subordinates or superiors, limiting the amount of communication overhead, which can be seen both as an asset or a limitation. It is easy to see where a hierarchical structure would be an effective solution; companies that have offices based in disparate locations, a business that focuses on diversified markets, any organization with need for multiple levels of middle management. You can easily create a clear hierarchical organizational chart using ConceptDraw solution that contains templates of the 25 Typical Orgcharts.HelpDesk
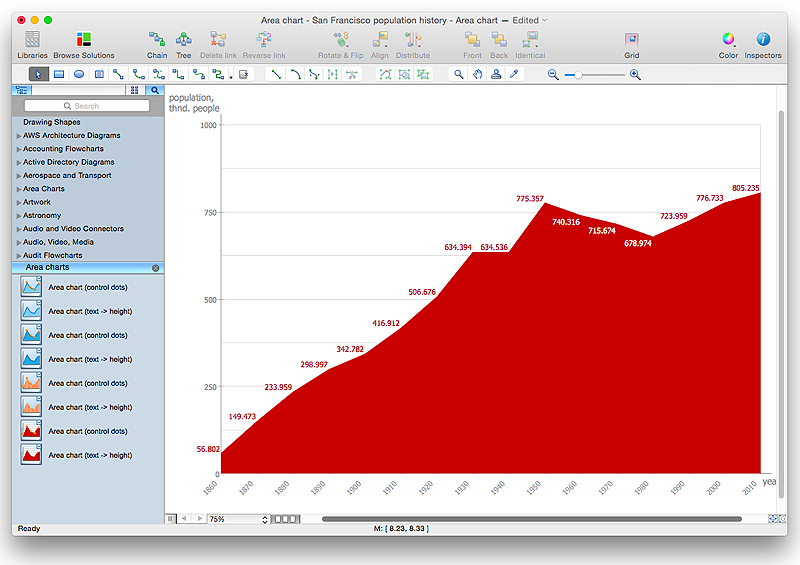
How to Draw an Area Chart in ConceptDraw PRO
Area chart is similar to a line chart, but an area chart has an area, commonly filled with color below the line. The applying of Line charts and area charts are also very similar. They both show continuity across a data set. They are both can be used for displaying time series data and for depicting tendencies better than separate values, but they have some different characteristics. Using the proper one is good chance to show once again a professionalism of your graphic documents. An area chart depicts a colored area below the line. The sum on the vertical axis of an area chart represents the entire value, while the height of each separate piece shows its parts. Area charts are used to display multiple data series with proportion to a whole value , or for separate data series showing a set of countable values, or cumulative data.HelpDesk
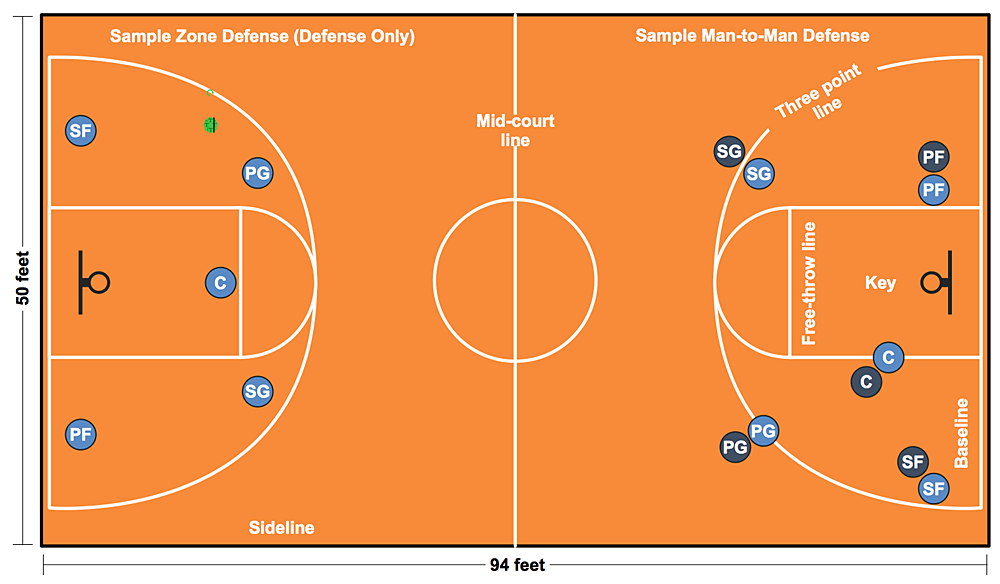
How to Make a Basketball Court Diagram
Basketball Court diagrams is often used as a teaching and learning tool for coaches, players and parents to describe the basketball moves and shooting drills. The ability to create Basketball diagrams with ConceptDraw PRO is contained in the Basketball solution. It provides a set of special tools for creating different Basketball diagrams. Basketball court diagram is used to describe basketball moves and shooting drills during the discussion of the match, as well as to develop a winning defense and attack strategy as a clear visual plans for future games.
 Organizational Charts
Organizational Charts solution extends ConceptDraw PRO software with samples, templates and library of vector stencils for drawing the org charts.
HelpDesk
How to Draw a Scatter Diagram Using ConceptDraw PRO
Scatter Diagrams are used to visualize how a change in one variable affects another. A Scatter Diagram displays the data as a set of points in a coordinate system. It combines these values into single data points and displays them in uneven intervals. A Scatter Diagram can be very useful to for identifying relationships between variables, for example the relationship of price and quality rating. Making a Scatter Diagram involves many different elements that can be managed using ConceptDraw Scatter Diagram solution.
 Scatter Diagrams
The Scatter Diagrams solution extends ConceptDraw PRO v10 functionality with templates, samples, and a library of vector stencils that make construction of a Scatter Plot easy. The Scatter Chart Solution makes it easy to design attractive Scatter Diagrams used in various fields of science, work, and life activities. ConceptDraw PRO lets you enter the data to the table and construct the Scatter Plot Graph automatically according to these data.
 Ice Hockey
The Ice Hockey Solution extends the capabilities of ConceptDraw PRO v9.5 (or later) with samples, templates, and libraries of vector objects for drawing hockey diagrams, plays schemas, and illustrations. The Ice Hockey Solution can be used to make polishe
HelpDesk
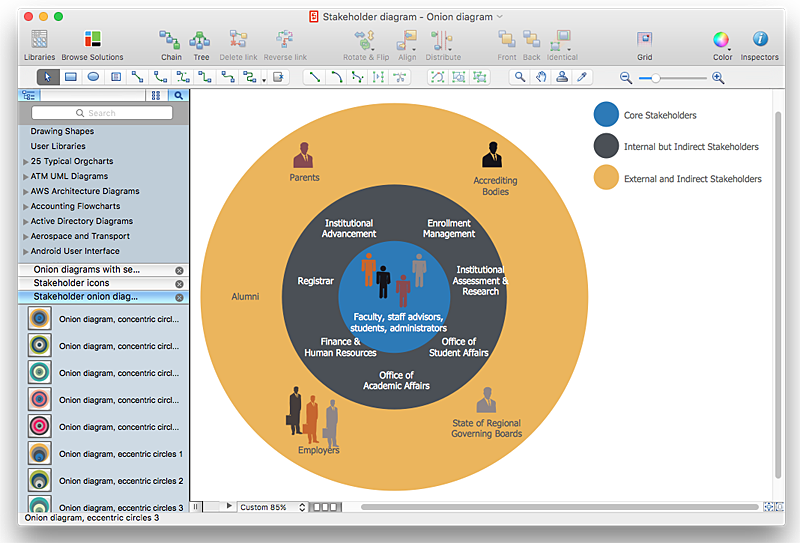
How to Create a Stakeholder Onion Diagram Using ConceptDraw PRO
The Stakeholder Onion Diagram is stakeholder analysis tool from the arsenal of project management. It is used to display the relationships of stakeholders to a project goal. An Onion Diagram shows how the stakeholder activities affect the project results. The ConceptDraw Stakeholder Onion Diagram solution is intended to depict how the relationships that subsists in a project environment can influence on a project. A set of libraries and objects provided by this solution make ashort work of visualizing the stakeholder analysis of a project.- Basketball Court Diagram and Basketball Positions | How to Make a ...
- Baseball Diagram – Defence Positions | Basketball Court Diagram ...
- Basketball Court Diagram and Basketball Positions | Quality Control ...
- Basketball Fielding Positions Chart
- Baseball Diagram – Defence Positions | Basketball Court Diagram ...
- Pyramid Chart Examples | 25 Typical Orgcharts | Basketball Court ...
- Pyramid Diagram and Pyramid Chart | Basketball Court Diagram ...
- Baseball Field Positions Chart
- Basketball Court Dimensions | Youth Baseball Position Chart
- Example Of Organization In Basketball And Their Position
- Football | Basketball Plays Diagrams | How to Make Soccer Position ...
- Football | Basketball Court Dimensions | Baseball Diagram ...
- Baseball Diagram – Defence Positions | Basketball Court ...
- Basketball Court Diagram and Basketball Positions | How to Make a ...
- Position Chart Of A Football Pitch
- Basketball Court Diagram and Basketball Positions | Cafe and ...
- Basketball Court Size Chart Centimeters
- Basketball Court Diagram and Basketball Positions | Baseball ...
- Baseball Field Position Chart


