BCG Matrix
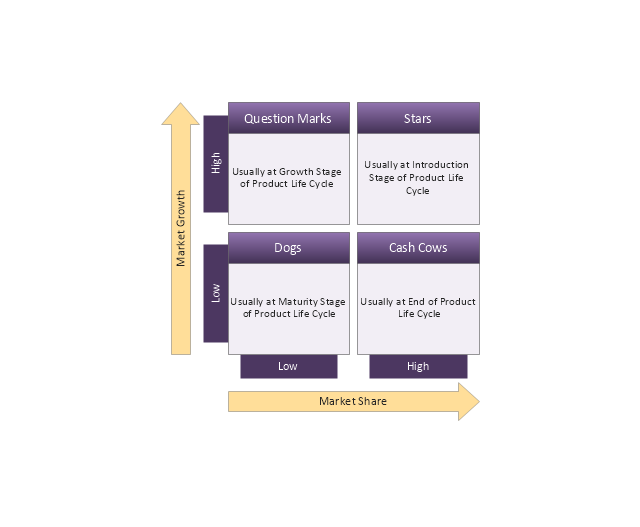
The growth–share matrix (BCG Matrix) was created by Bruce D. Henderson for the Boston Consulting Group in 1970 to help corporations to analyze their business units and to help the company allocate resources. How is it easy design the BCG Matrices in ConceptDraw DIAGRAM diagramming and vector drawing software supplied with unique Matrices Solution from the Marketing Area of ConceptDraw Solution Park."The growth–share matrix (aka the product portfolio, BCG-matrix, Boston matrix, Boston Consulting Group analysis, portfolio diagram) is a chart that was created by Bruce D. Henderson for the Boston Consulting Group in 1970 to help corporations to analyze their business units, that is, their product lines. This helps the company allocate resources and is used as an analytical tool in brand marketing, product management, strategic management, and portfolio analysis. ...
To use the chart, analysts plot a scatter graph to rank the business units (or products) on the basis of their relative market shares and growth rates.
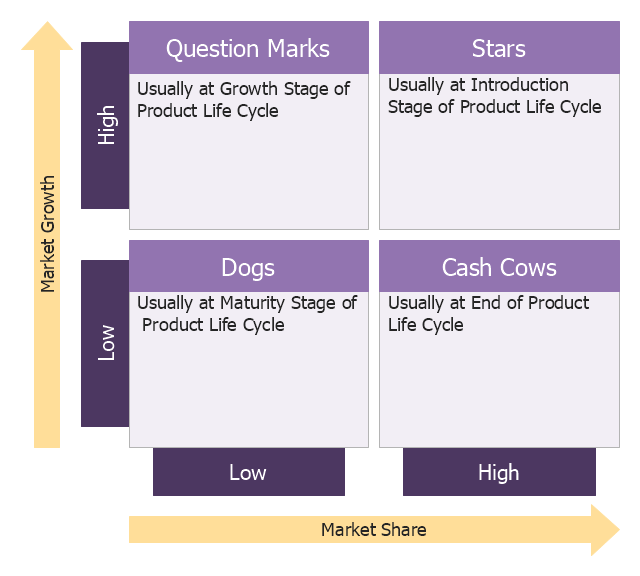
Cash cows is where company has high market share in a slow-growing industry. ...
Dogs, more charitably called pets, are units with low market share in a mature, slow-growing industry. ...
Question marks (also known as problem children) are business operating in a high market growth, but having a low market share. ...
Stars are units with a high market share in a fast-growing industry." [Growth–share matrix. Wikipedia]
This Boston growth-share (BCG) matrix diagram example was created using the ConceptDraw PRO diagramming and vector drawing software extended with the Matrices solution from the Marketing area of ConceptDraw Solution Park.
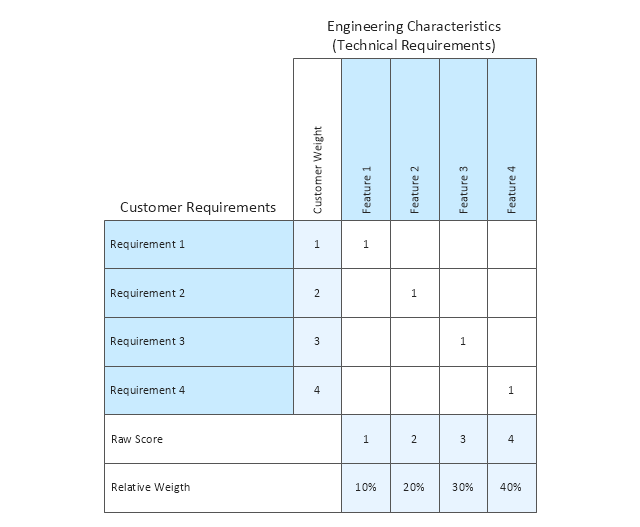
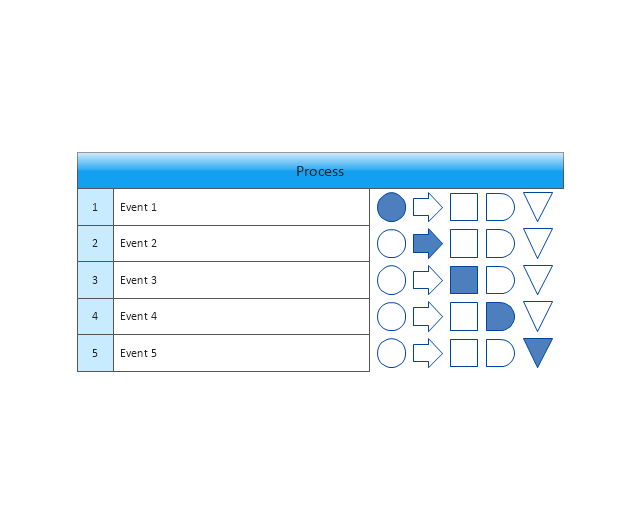
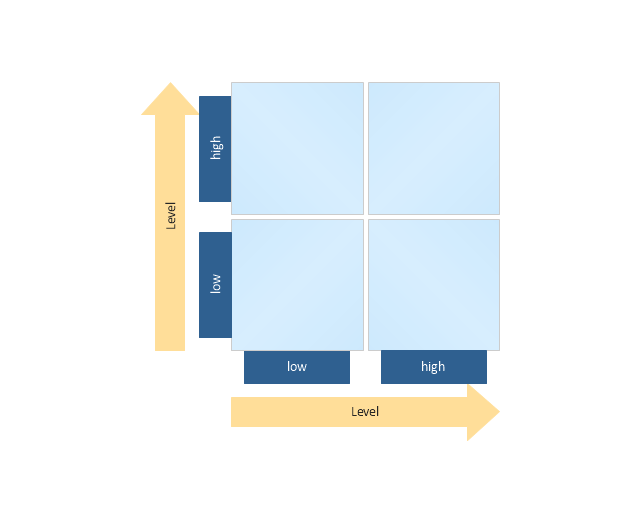
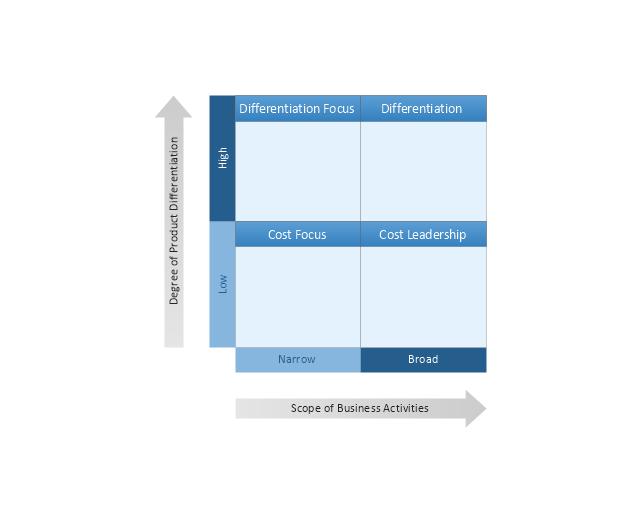
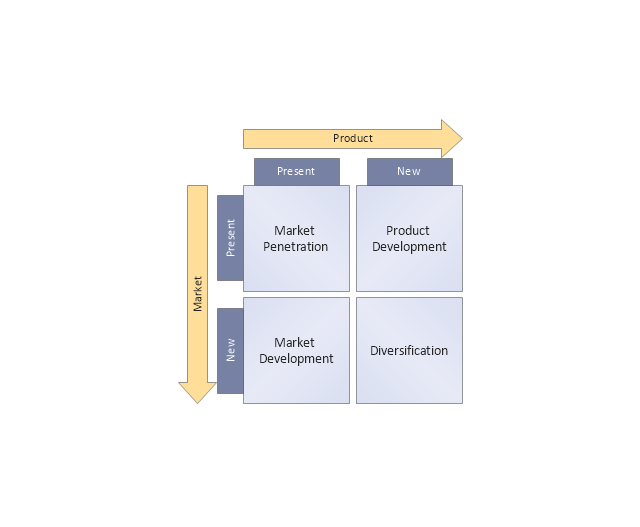
The vector stencils library "Matrices" contains 10 templates of marketing matrix diagrams and charts.
Use these templates to create your marketing matrices in the ConceptDraw PRO diagramming and vector drawing software extended with the Matrices solution from the Marketing area of ConceptDraw Solution Park.
Use these templates to create your marketing matrices in the ConceptDraw PRO diagramming and vector drawing software extended with the Matrices solution from the Marketing area of ConceptDraw Solution Park.
Bubble Plot
This sample was created in ConceptDraw DIAGRAM diagramming and vector drawing software using the Bubble Diagrams Solution from the ConceptDraw Solution Park. This sample shows the BCG (Boston Consulting Group) matrix that is used in marketing and product management for strategic analysis and planning.The vector stencils library "Matrices" contains 10 templates of marketing matrix diagrams and charts.
Use these templates to create your marketing matrices in the ConceptDraw PRO diagramming and vector drawing software extended with the Matrices solution from the Marketing area of ConceptDraw Solution Park.
Use these templates to create your marketing matrices in the ConceptDraw PRO diagramming and vector drawing software extended with the Matrices solution from the Marketing area of ConceptDraw Solution Park.
BCG Matrix helps to allocate resources, and it's used in brand marketing, product and strategic management, portfolio analysis. It assumes that an increase in relative market share will result in an increase in the cash generation, and that a growing market requires investment in assets to increase capacity and results in the cash consumption. The position of a business on the matrix provides an indication of its cash generation and consumption. The 4 categories are: Dogs; Question marks; Stars; Cash cows. The matrix is also used for resource allocation among products in a single business unit: the relative positions of the firm's business portfolio are displayed in a single diagram.
The template "Boston growth-share matrix" for the ConceptDraw PRO diagramming and vector drawing software is included in the Matrices solution from the Marketing area of ConceptDraw Solution Park.
The template "Boston growth-share matrix" for the ConceptDraw PRO diagramming and vector drawing software is included in the Matrices solution from the Marketing area of ConceptDraw Solution Park.
Growth-Share Matrix Software
Growth-Share Matrix Software - ConceptDraw DIAGRAM is a powerful diagramming and vector drawing software for creating professional looking Growth–Share Matrices. For simple and quick creating the Growth–Share Matrix ConceptDraw DIAGRAM offers the Matrices Solution from the Marketing Area of ConceptDraw Solution Park. The Matrices Solution also provides a wide variety of templates and samples that will help you to create the Matrix diagrams of any difficulty.MindMap Presentation
Mindmap Presentation. Present Mindmaps via Skype with ConceptDraw MINDMAP.
 Matrices
This solution extends ConceptDraw DIAGRAM software with samples, templates and library of design elements for drawing the business matrix diagrams.
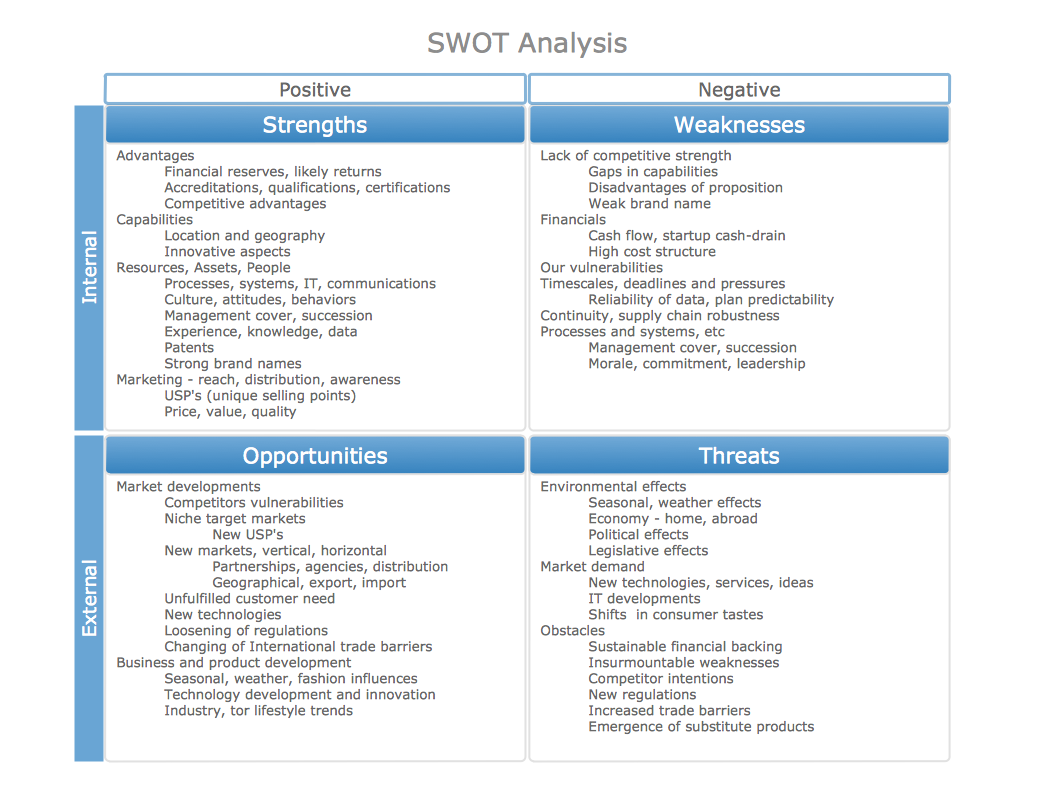
SWOT Analysis matrix templates and samples
SWOT Analysis solution extends ConceptDraw MINDMAP and ConceptDraw DIAGRAM products with easy-to-use SWOT Analysis tools.Matrices
ConceptDraw DIAGRAM extended with Matrices Solution from the Marketing Area of ConceptDraw Solution Park is a powerful software for drawing various types of Marketing Matrices: Ansoff Matrix, BCG Matrix, Deployment Chart, Feature Comparison Chart, Competitive Strategies Matrix, Flow Process Chart, Porter's Value Chain Diagram, Positioning Map, and many others.Positioning Map
ConceptDraw DIAGRAM is a powerful diagramming and vector drawing software. Extended with Matrices Solution from the Marketing Area of ConceptDraw Solution Park it became the best software for quick and easy designing various types of Matrix Diagrams, including Positioning Map.Root Cause Tree Diagram
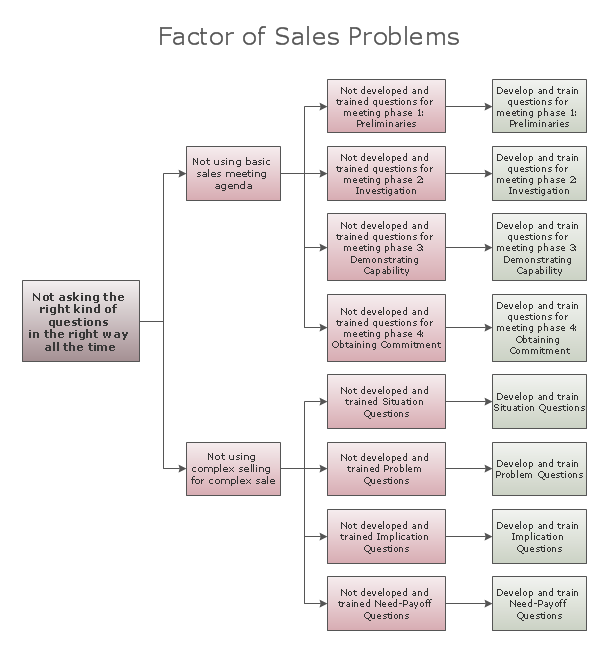
Root Cause Tree Diagram is one of the best tools to outline the problems and their causes, to analyze them and to formulate the possible corrective actions. Root Cause Tree Diagrams are successfully used in management, marketing, quality control and depth analysis, and are based on the principle that solution of any problem is concentrated at the root. Root Cause Tree Diagram contains the main problem on the top, from the top depart two branches of causes, which then diverge on additional causes, thus is constructed the hierarchy of root causes. So, the step by step defining of causes lets to detect the main reasons of a given effect and to make the correct arrangements to solve a problem. The ConceptDraw MINDMAP and ConceptDraw DIAGRAM products included to ConceptDraw Office suite, with help of Business Productivity solutions from the ConceptDraw Solution Park are effective in questions of problem solving, defining root causes of various problems, root causes analysis and designing the Root Cause Tree Diagrams.CORRECTIVE ACTIONS PLANNING. Involvement Matrix
The Involvement Matrix can identify the distribution of responsibilities and identify roles in a group or team. Use the Involvement Matrix to specify roles and responsibilities of actions in problem solving. ConceptDraw Office suite is a software for corrective actions planning.
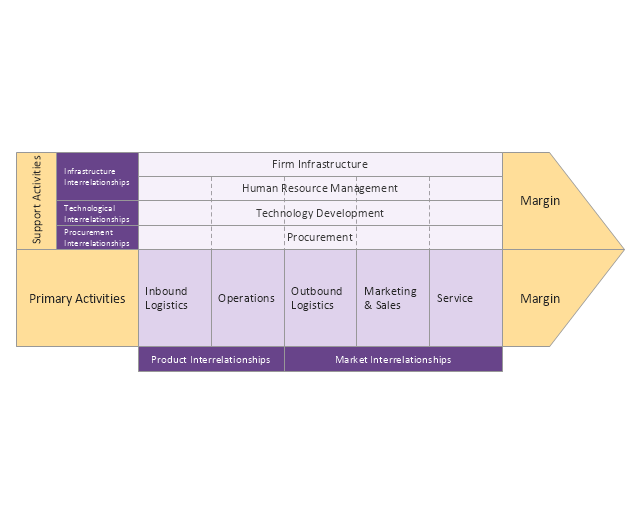
Porter's Value Chain
ConceptDraw DIAGRAM diagramming and vector drawing software offers you the Matrices Solution from the Marketing Area with extensive drawing tools for creating the Porter's Value Chain diagrams.Software for Creating SWOT Analysis Diagrams
SWOT analysis or alternatively SWOT matrix is a simple, but useful tool for auditing an organization and its environment, for analyzing its strengths and weaknesses, opportunities and threats that can appear. A SWOT analysis can be executed for an industry, product, place, or person. It is a first stage of planning which helps the marketing specialists to focus on the key issues. SWOT analysis includes the identification of objectives of the project or business venture, specification of internal and external factors favorable and vice versa unfavorable for achievement the designated goal. ConceptDraw DIAGRAM ector graphics software enhanced with SWOT and TOWS Matrix Diagrams solution from Management area of ConceptDraw Solution Park is a powerful software for creating SWOT analysis diagrams. Ready-to-use templates, samples and examples allow create your own TOWS and SWOT matrices in minutes. The integration between ConceptDraw MINDMAP and ConceptDraw DIAGRAM applications will be also helpful for easier drawing.What is SWOT Analysis?
What is SWOT analysis? The SWOT abbreviation is formed from the reduction of four words - strength, weakness, opportunity and threat, on which is based the SWOT analysis. It is a structured planning method that involves the analysis of the situation within a company, as well as analysis of external factors and the situation on the market. SWOT analysis emphasizes that the strategy must to combine the internal capabilities and external situation the best way as possible. The use of SWOT analysis allows to systemize all available information and apply this clear picture to make informed decisions concerning to your business development. In fact, SWOT analysis is an intermediate step between the formulation of goals and the statement of problem. The main goal is a sustainability and improvement of efficiency of business functioning. When you have an installed ConceptDraw DIAGRAM software, it gives you a lot of benefits in SWOT analysis. Use the powerful drawing tools and capabilities of the SWOT and TOWS Matrix Diagrams solution to hold the SWOT analysis effectively and with pleasure.How to Make SWOT Analysis in a Word Document
A SWOT Analysis is a popular tool of the strategic planning which is used to evaluate the Strengths, Weaknesses, Opportunities, and Threats that are involved in any businesses. Use of mind maps allows you to collect a lot of information used for SWOT Analysis, visually structure it and also identify the relationships between different parts of this information. SWOT and TOWS Matrix Diagrams solution for ConceptDraw Solution Park combines professional visual advantages of ConceptDraw MINDMAP software and presentation capabilities of ConceptDraw DIAGRAM , which together provide a complete work solution. The SWOT and TOWS diagrams, matrices or mind maps produced in ConceptDraw DIAGRAM using the predesigned vector objects or filling the ready templates, can be then easily exported to Microsoft Word, Microsoft Visio, Microsoft PowerPoint, Adobe PDF, and many other electronic file formats. The possibility of export makes easy the use of SWOT diagrams designed in ConceptDraw DIAGRAM and lets you efficiently collaborate even with people who maybe don't have this software.Swot Analysis Examples
SWOT analysis is an advanced plan making methodology for detection the Strengths and Weaknesses, Opportunities and Threats, that are involved in a project. SWOT analysis possesses a wide variety of real and potential applications and is a key part of any business planning and analysis. SWOT analysis uses as a visual tool the SWOT diagrams and SWOT matrices. ConceptDraw DIAGRAM software with SWOT and TOWS Matrix Diagrams solution provides a lot of SWOT analysis examples and samples, and also numerous collection of built-in SWOT templates, which will be the good start in your self-depending drawing and the perfect source of inspiration. You can always start to design your SWOT diagrams from the blank sheet using the included predesigned vector objects, but in many cases to save the time and efforts for SWOT diagramming would be preferable to use the ready example the most appropriate to your needs. Customizing the proposed SWOT diagrams you will achieve a great success in drawing SWOT matrices of any style and complexity.SWOT Analysis Tool for Small Business
SWOT analysis is effective method of making the plan to evaluate the Strengths, Weaknesses, Opportunities, and Threats involved in a project. SWOT analysis includes the specifying project objectives and attentive identifying the internal and external causes for accomplishing the main project goals. It is actively used in large and small business project management for effective and clear identifying the critical factors. SWOT and TOWS Matrix Diagrams solution is included to ConceptDraw Solution Park and contains the high-quality analysis tools. This graphical solution turns the ConceptDraw DIAGRAM software in an excellent marketing management and advertising agency software, the best SWOT analysis tool for small business or large, as you like and need. Included graphic tools, visual and project planning components make it the best marketing project management software for marketing project planning and for making marketing presentations. Use the ConceptDraw DIAGRAM to create professional and well-designed SWOT matrices in minutes.- BCG Matrix | Swot Analysis Examples | SWOT Analysis matrix ...
- Matrices | Ansoff Matrix | Business Tools Perceptual Mapping ...
- Matrices | Competitor Analysis | BCG Matrix | Types Of Matrix In ...
- BCG Matrix | How to Make SWOT Analysis in a Word Document ...
- BCG Matrix | Growth-Share Matrix Software | SWOT Sample in ...
- Boston growth-share ( BCG ) matrix diagram | Draw A Bcg Matrix In ...
- Competitor Analysis | BCG Matrix | Growth-Share Matrix Software ...
- BCG Matrix | Stakeholder Management System | Pyramid Chart ...
- Boston growth-share ( BCG ) matrix diagram | Matrices | Example Of ...
- Boston growth-share ( BCG ) matrix diagram | Boston Consulting ...
- BCG Matrix | Growth-Share Matrix Software | Matrix Organization ...
- Boston growth-share matrix - Template | BCG Matrix | Growth-Share ...
- BCG Matrix | Competitor Analysis | PDPC | Strategic Planning Excel
- Boston growth-share matrix - Template | Boston growth-share ( BCG ...
- What is SWOT Analysis? | BCG Matrix | Business Tools Perceptual ...
- BCG Matrix | Competitor Analysis | Ansoff Matrix | Bcg Matrix Graph
- Boston growth-share matrix - Template
- Matrices | Difference Between Bcg Matrix And Ansoff Matrix
- BCG Matrix | Growth-Share Matrix Software | Matrices | Visio Boston ...

-matrix-diagram.png--diagram-flowchart-example.png)
