Basic Diagramming
Perfect charts and graphics diagramming software with rich examples and template. ConceptDraw is ideal to draw Charts and Graphics.
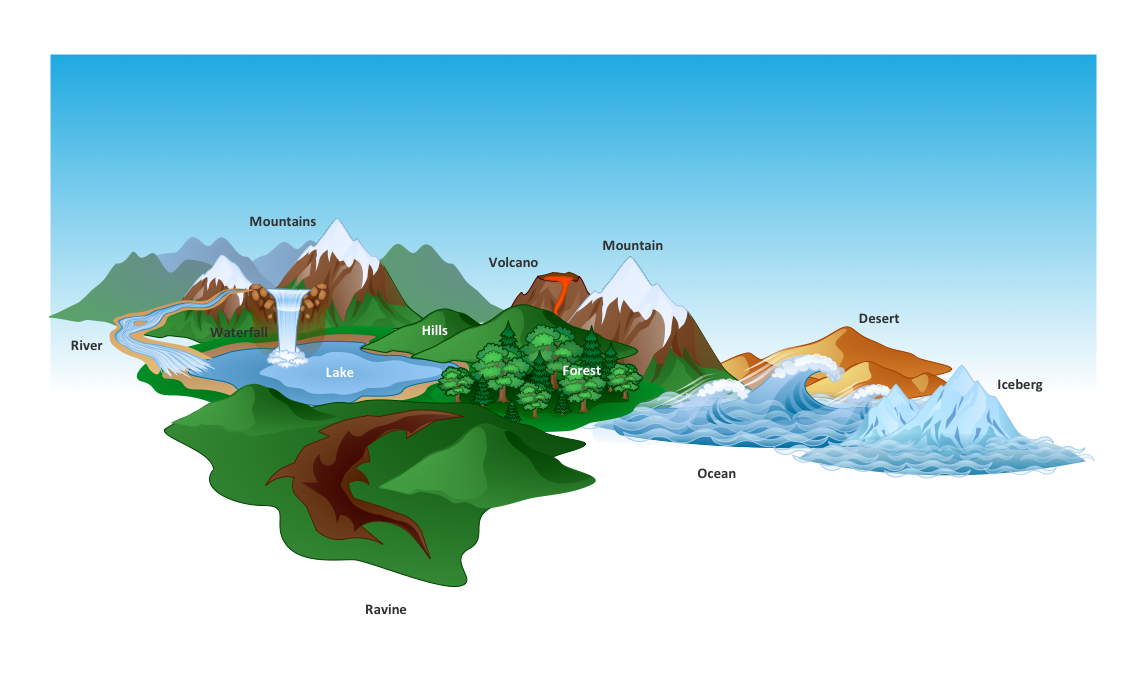
Beautiful Nature Scene: Drawing
The Nature Solution addition to ConceptDraw Solution Park for ConceptDraw PRO includes new libraries that provide a wide range nature objects and it can be used to augment documentation and graphics. Draw beautiful nature scenes using ConceptDraw PRO software with Nature solution.Drawing Illustration
The Nature Solution addition to ConceptDraw Solution Park for ConceptDraw PRO includes new libraries that provide a wide range nature objects and it can be used in many areas.Pie Chart Examples and Templates
A pie chart or a circle graph is a circular chart divided into sectors, illustrating numerical proportion. In a pie chart, the arc length of each sector and consequently its central angle and area, is proportional to the quantity it represents. Pie chart examples and templates created using ConceptDraw PRO software helps you get closer with pie charts and find pie chart examples suite your needs.Create Graphs and Charts
Charting Software allows you to create diagrams, charts, graphs, flowcharts, and other business graphics. ConceptDraw PRO include simple shape drawing tools, examples, templates, and symbol libraries.How can you illustrate the weather condition
Use it to make professional looking documents, presentations, and websites illustrated with color scalable vector clipart for geography, weather, and animals.Horizontal Flowchart
This sample was created in ConceptDraw PRO diagramming and vector drawing software using the Flowcharts solution from the What is a Diagram area of ConceptDraw Solution Park. A Flowchart is a graphically representation of the process, algorithm or the step-by-step solution of the problem. The Flowcharts have one or more starting and ending points. The geometric figures on the Flowcharts represent the steps of the process and are connected with arrows that show the sequence of the actions.Vertical Cross Functional Flowchart
ConceptDraw PRO is a powerful tool that helps you create professional looking cross-functional flowcharts with the well-designed objects. ConceptDraw PRO - Drawing Software for Vertical Cross Functional Flowchart. ConceptDraw allows you to focus on work, not the drawing process. ConceptDraw Arrows10 Technology allows to draw connectors with smart behavior that gives flexibility to you during work process.Column Chart Software
ConceptDraw Column Chart software allows drawing column charts using predesigned objects or drawing tools. In ConceptDraw Column Chart software you can find a complete set of column chart tools and objects.Sales Growth. Bar Graphs Example
This sample was created in ConceptDraw PRO diagramming and vector drawing software using the Bar Graphs Solution from Graphs and Charts area of ConceptDraw Solution Park. It is Bar Graphs example, Sales Growth example, Column Chart Example - Sales Report.Column Chart Template
Column chart templates from ConceptDraw collection can help you find the best visual depiction for you data. You can easily modify column chart templates according to data you want to visualize.Beauty of Event-driven Process Chain (EPC) diagrams
Event-Driven Process Chain Diagrams for improvement throughout an organisation. ConceptDraw PRO - software that reduces the time needed to create a business process model.Basic Diagramming
Create flowcharts, organizational charts, bar charts, line graphs, and more with ConceptDraw PRO.
Pie Chart Word Template. Pie Chart Examples
The Pie Chart visualizes the data as the proportional parts of a whole and looks like a disk divided into sectors. The pie chart is type of graph, pie chart looks as circle devided into sectors. Pie Charts are widely used in the business, statistics, analytics, mass media. It’s very effective way of displaying relative sizes of parts, the proportion of the whole thing.Sample Pictorial Chart. Sample Infographics
Sample Pictorial Chart - Pictorial Infographics solution provides easy-to-use design infographics drawing tools, large collection of different sample infographics and infograms, sample pictorial chart and templates to be filled in, and 10 libraries with great quantity of predesigned vector pictograms. Use Pictorial Infographics solution to draw your own design pictorial infographics documents quick and easy.- Basic Diagramming | Beautiful Nature Scene: Drawing | Horizontal ...
- Beautiful Nature Scene: Drawing | Drawing Illustration | Pie Chart ...
- Beautiful Nature Scene: Drawing | Scientific Symbols Chart ...
- Column Chart Software | Beautiful Nature Scene: Drawing | Basic ...
- Beautiful Nature Scene: Drawing | Basic Diagramming | Horizontal ...
- How To Draw Beautiful Pics Of Water In Chart
- Beautiful Pictures To Draw On Chart
- Basic Diagramming | Beautiful Nature Scene: Drawing | Chart ...
- Drawing Illustration | Map Software | Beautiful Nature Scene ...
- Beautiful Drawing On Chart
- Basic Diagramming | Beautiful Nature Scene: Drawing | Basic ...
- How To Draw Beautiful Drawing Chart
- Beautiful Nature Scene: Drawing | Process Flow Chart | Pie Chart ...
- Samples Of Beautiful Charts With Pictures Draw On It
- Beautiful Nature Scene: Drawing | Drawing Illustration | Basic ...
- Basic Diagramming | Beautiful Nature Scene: Drawing | Pie Chart ...
- Drawing Illustration | Beautiful Nature Scene: Drawing | Basic ...
- Beautiful Nature Scene: Drawing | Drawing Illustration | How can ...
- Drawing Illustration | Beautiful Nature Scene: Drawing | Basic ...
- Beautiful Nature Scene: Drawing | Flow Chart On Save The Earth


