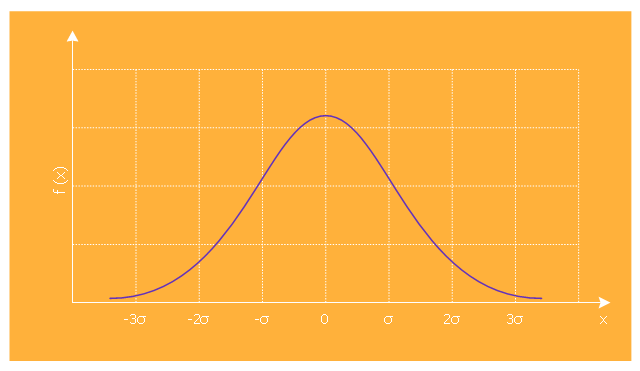
Normal (or Gaussian) distribution (bell curve) graph visualize a continuous probability distribution that is often used as a first approximation to describe real-valued random variables that tend to cluster around a single mean value.
The template "Normal distribution graph" for the ConceptDraw PRO diagramming and vector drawing software is included in the Marketing Diagrams solution from the Marketing area of ConceptDraw Solution Park.
www.conceptdraw.com/ solution-park/ marketing-diagrams
The template "Normal distribution graph" for the ConceptDraw PRO diagramming and vector drawing software is included in the Marketing Diagrams solution from the Marketing area of ConceptDraw Solution Park.
www.conceptdraw.com/ solution-park/ marketing-diagrams
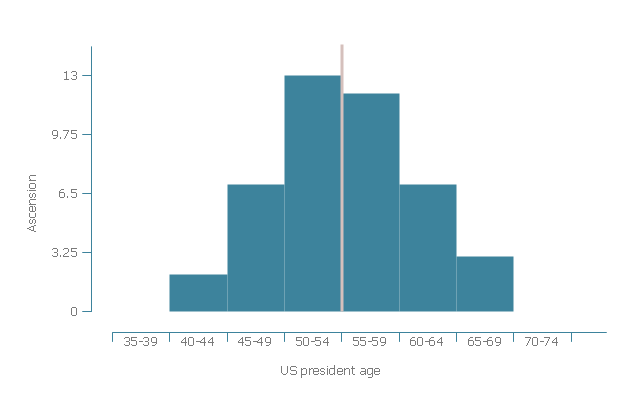
This histogram example was redesigned from the Wikimedia Commons file: Age of presidental ascention.jpg.
"Age of US president at date of ascension to office in five-year age groups."
[commons.wikimedia.org/ wiki/ File:Age_ of_ presidental_ ascention.jpg]
This file is licensed under the Creative Commons Attribution-Share Alike 3.0 Unported license. [creativecommons.org/ licenses/ by-sa/ 3.0/ deed.en]
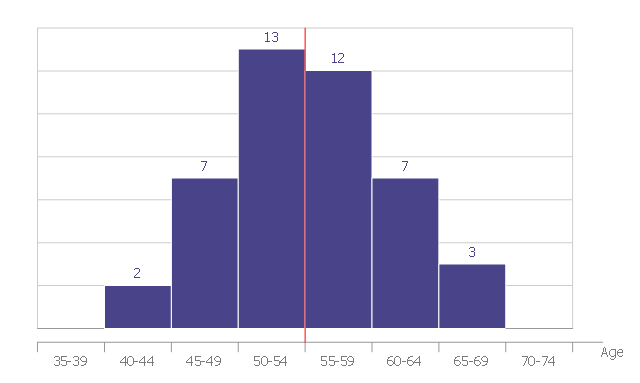
"Age of presidents when assuming office approximately follows a bell curve (mean age marked by red line, c. 55 years)" [List of Presidents of the United States by age. Wikipedia]
The histogram example "Age of presidential ascension" was created using the ConceptDraw PRO software extended with the Seven Basic Tools of Quality solution from the Quality area of ConceptDraw Solution Park.
This histogram example shows how the age of presidents when assuming office approximately follows a bell curve. It was redesigned from the Wikimedia Commons file: Age of presidental ascention.jpg.
[commons.wikimedia.org/ wiki/ File:Age_ of_ presidental_ ascention.jpg]
This file is licensed under the Creative Commons Attribution-Share Alike 3.0 Unported license. [creativecommons.org/ licenses/ by-sa/ 3.0/ deed.en]
"Under the United States Constitution, the President of the United States is the head of state and head of government of the United States. As chief of the executive branch and head of the federal government as a whole, the presidency is the highest political office in the United States by influence and recognition. The president is also the commander-in-chief of the United States Armed Forces. The president is indirectly elected to a four-year term by an Electoral College (or by the House of Representatives should the Electoral College fail to award an absolute majority of votes to any person)." [List of Presidents of the United States. Wikipedia]
"The median age of accession is 54 years and 11 months, which falls between Herbert Hoover (22nd youngest) and Lyndon B. Johnson (23rd). The youngest person to assume office was Theodore Roosevelt (age 42), who became president following William McKinley's assassination. The youngest president elected to office was John F. Kennedy (age 43 years, 236 days). The oldest president to assume office was Ronald Reagan (age 69 years, 349 days)." [List of Presidents of the United States by age. Wikipedia]
The histogram example "Age of presidental ascention" was created using the ConceptDraw PRO diagramming and vector drawing software extended with the Histograms solution from the Graphs and Charts area of ConceptDraw Solution Park.
- Can A Bar Chart A Bell Curve
- Normal distribution graph - Template | Normal (Gaussian ...
- Normal (Gaussian) distribution graph | Frequency Distribution ...
- Normal distribution | Normal distribution graph - Template | How To ...
- Frequency Distribution Dashboard | Building Drawing Software for ...
- How to Draw a Scatter Diagram Using ConceptDraw PRO | Normal ...
- Making a Histogram | Histogram example - Age of presidential ...
- Normal distribution graph - Template | Scatter graph - Template ...
- UML Diagram | Basic Flowchart Symbols and Meaning | Cisco IBM ...
- How to Draw a Histogram in ConceptDraw PRO | Histogram ...
- Histogram Chart | Flowchart Marketing Process. Flowchart Examples ...
- Basic Flowchart Symbols and Meaning | Hotel Network Topology ...
- Diffusion of innovations graph | Marketing diagrams - Vector stencils ...
- F&B | Websites interlinking to illustrate PageRank | Chemical ...
- Area chart - Template | Line Chart Template for Word | Pie Chart ...
- How to Set Line Jumps for Smart Connectors in ConceptDraw PRO ...
- Design elements - Instruments | Piping and Instrumentation Diagram ...
- Interior Design Office Layout Plan Design Element | Instruments ...
- Sport pictograms. Olympic Games | Design elements - Marketing ...
- Biology Drawing Software | Professions - Vector stencils library | In ...


