 Stakeholder Onion Diagrams
The Stakeholder Onion Diagram is often used as a way to view the relationships of stakeholders to a project goal. A basic Onion Diagram contains a rich information. It shows significance of stakeholders that will have has influence to the success achieve
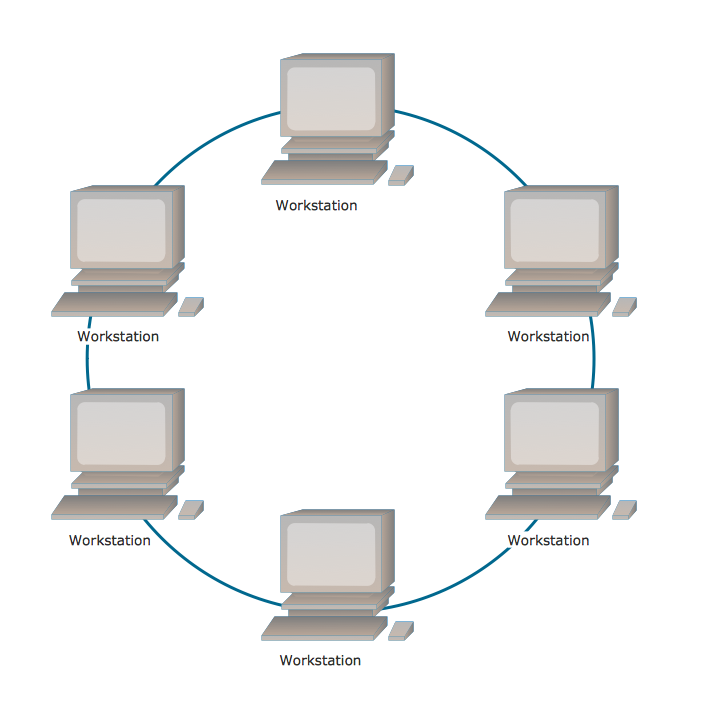
Ring Network Topology
The Ring Network Topology Diagram examples was created using ConceptDraw PRO software with Computer and Networks solution.How to draw Metro Map style infographics? (New York)
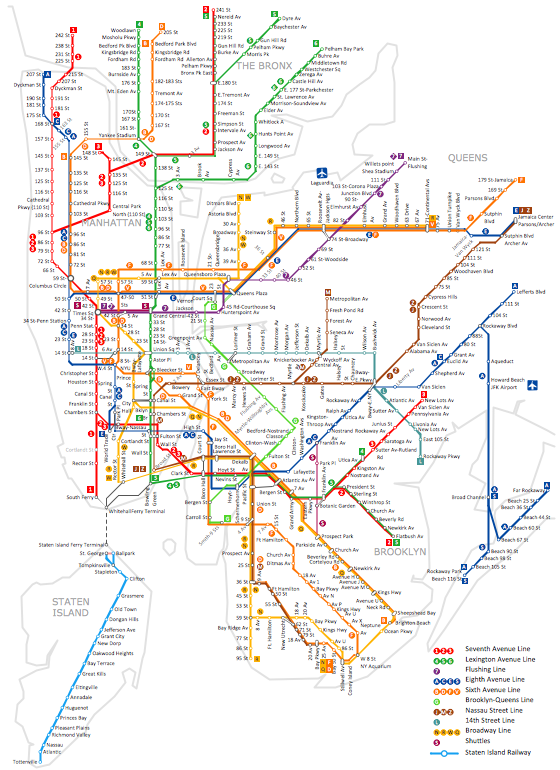
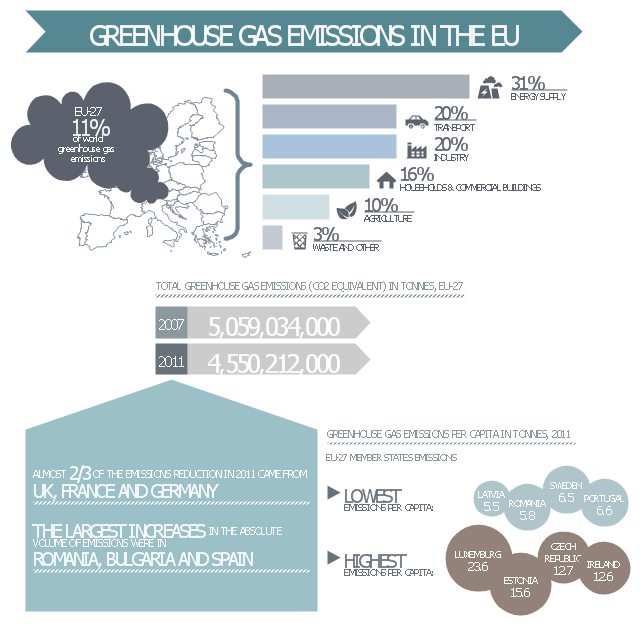
How to draw Metro Map style infographics of New York subway. New York Subway has a long history starting on October 27, 1904. Since the opening many agencies have provided schemes of the subway system. At present time are 34 lines in use. This page present New York City subway map construct with Metro Map Solution in Conceptdraw PRO software. This is a one-click tool to add stations to the map. It lets you control the direction in which you create new stations, change lengths, and add text labels and icons. It contains Lines, Stations, and Landmarks objectsThis ecology infographic example was created on the base of the infographics "Greenhouse gas emissions in the EU" from the Debating Europe website. [debatingeurope.eu/ wp-content/ uploads/ 2013/ 06/ TH_ 2_ social.png]
"A greenhouse gas (sometimes abbreviated GHG) is a gas in an atmosphere that absorbs and emits radiation within the thermal infrared range. This process is the fundamental cause of the greenhouse effect. The primary greenhouse gases in the Earth's atmosphere are water vapor, carbon dioxide, methane, nitrous oxide, and ozone. Greenhouse gases greatly affect the temperature of the Earth; without them, Earth's surface would average about 33 °C colder, which is about 59 °F below the present average of 14 °C (57 °F)." [Greenhouse gas. Wikipedia]
The ecology infographic example "EU greenhouse gas emissions" was created using the ConceptDraw PRO diagramming and vector drawing software extended with the Management Infographics solition from the area "Business Infographics" in ConceptDraw Solution Park.
Used Solutions
- Draw A Flow Chart To Show The Primary Sector Of Any Good The ...
- The Flow Chart Of Primary Sector And Secondary Sector And Tertiary
- The Flowchart Of A Primary Sector
- Flow Chart Of The Primary Sector Secondary Sector And Tertiary ...
- Flow Chart Of Clothing Including Primary Sector Secondary Sector ...
- Divided Bar Diagrams | Pictures For Primary Sector For Drawing
- Economic sector weightings | Secondary Sector By Drawing
- Primary Industry Examples With Drawing
- Sector weightings - Exploded pie chart | Exploded pie chart ...
- Draw Or Design A Picture That Represents A Products Of Primary ...
- Sector weightings - Exploded pie chart | Telecom equipment - Vector ...
- Design A Picture Which Shows Primary Sector
- Draw Or Desing A Picture That Represents A Producy Of Each ...
- Show Diagram For Secondary Sector
- Diagram Of Primary Industry
- Draw Or Design A Picture That Represents Primary Secondary And ...
- Porter's value chain matrix diagram | Flow chart Example ...
- Draw Are Pictures That Represents Primary Sector Secondary ...
- A Picture That Represent A Product Of Primary Sector
- Design A Picture Of Primary Sector


