HelpDesk
How to Create a Timeline Diagram in ConceptDraw PRO
A Timeline is a chart which displays a project plan schedule in chronological order. A Timeline is used in project management to depict project milestones and visualize project phases, and show project progress. The graphic form of a timeline makes it easy to understand critical project milestones, such as the progress of a project schedule. Timelines are particularly useful for project scheduling or project management when accompanied with a Gantt chart. It captures the main of what the project will accomplish and how it will be done. making a project timeline is one of the most important skills a project manager needs have. Making comprehensive, accurate timelines allows you getting every project off in the best way. ConceptDraw PRO allows you to draw a timeline charts using special library.HelpDesk
Accounting Information Systems Flowchart Symbols
Accounting Information system is a combination of software and hardware, as well as organizational support. Information system - it is not only the software and computers with network equipment, but also a list of instructions and standards which can be notated using Accounting information systems flowchart symbols. All information systems can be divided into information retrieval and data processing systems. Data Flow model is a hierarchical model. Each process can be divided into structural components, that depict by corresponding flowchart symbols, showing the accounting information system in communication with the external environment. The major components of accounting information systems flowchart are: entities, processes, data stores, and data flows. The set of standard accounting information flowchart symbols is intended to show the relationships between the system components. ConceptDraw PRO can help to draw clear accounting information system diagrams using special flowchart symbols.
 ConceptDraw Solution Park
ConceptDraw Solution Park collects graphic extensions, examples and learning materials
HelpDesk
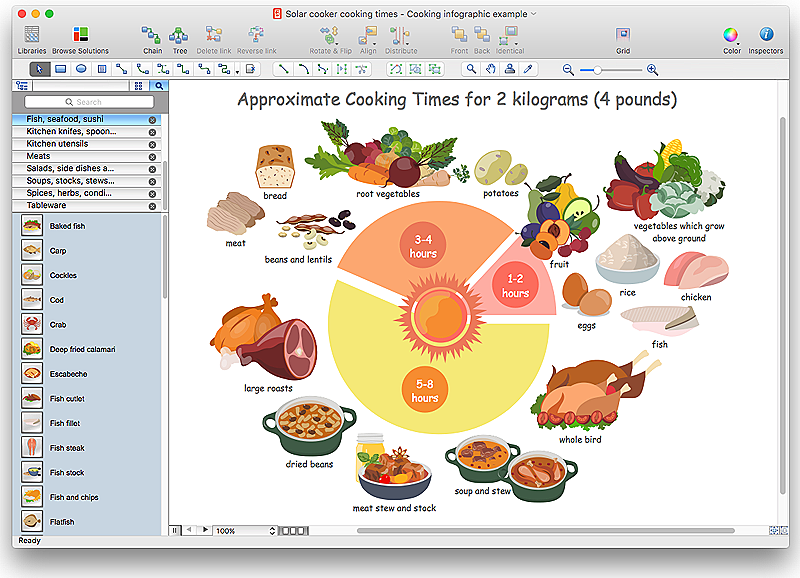
How to Design a Food-related Infographics Using ConceptDraw PRO
Today a large piece of business is referred to a food. This business can not be imagined without various kinds of visualizations. You can see them everywhere — on brand logos, in advertising, on menus and in flyers. Also different food related infographics is used to promote healthy nutrition and to deliver information on how to maintain an effective diet. ConceptDraw Cooking Recipes solution, offers a great collection of bright food-related images and icons, placed into themed libraries. It can be used for catering menu graphics, on marketing flyers, or as concomitant text for infographics.- Process Flowchart | Air Pressure Could Be Best Depicted In A Pie ...
- Process Flowchart | Content Could Be Best Depicted In A Pie ...
- Pie Daigram Best Depicted In A Pie Diagram
- Which Content Best Depicted In A Pie Diagram
- Pyramid Diagram and Pyramid Chart | How to Draw a Pie Chart ...
- Pie Chart Software | The Best Flowchart Software Available | Simple ...
- Business Report Pie. Pie Chart Examples | Bar Chart Examples ...
- Best Diagramming Software for Mac | Flow chart Example ...
- How to Draw an Organization Chart | How to Draw a Pie Chart Using ...
- How to Draw the Different Types of Pie Charts | How to Draw a Pie ...
- Pie Chart Software | Flow Chart Symbols | Bar Chart Software ...
- How to Create a Timeline Diagram in ConceptDraw PRO | Pie Chart ...
- Examples of Flowcharts, Org Charts and More | Pie Chart Examples ...
- Basic Diagramming | Bar Graph | Best Diagramming Software for ...
- Pie Charts | Pie Chart Examples and Templates | How to Create a ...
- Create Graphs and Charts | Business Diagram Software | Business ...
- Pie Chart Of A Good Relationship
- Legend For Flow Chart Symbols
- How to Create Flowchart Using Standard Flowchart Symbols ...
- Best Diagramming Software for Mac | Flow chart Example ...


