ConceptDraw DIAGRAM The best Business Drawing Software
ConceptDraw DIAGRAM is new software for business and technical drawing. Powerful business drawing tools, extensive libraries with pre-drawn shapes, free samples of business drawings, technical drawings and flowcharts, support of many graphic formats enable users to visually develop their business drawings charts and diagrams in any combination of drawings, diagrams and flow charts.Cisco Network Diagram Software
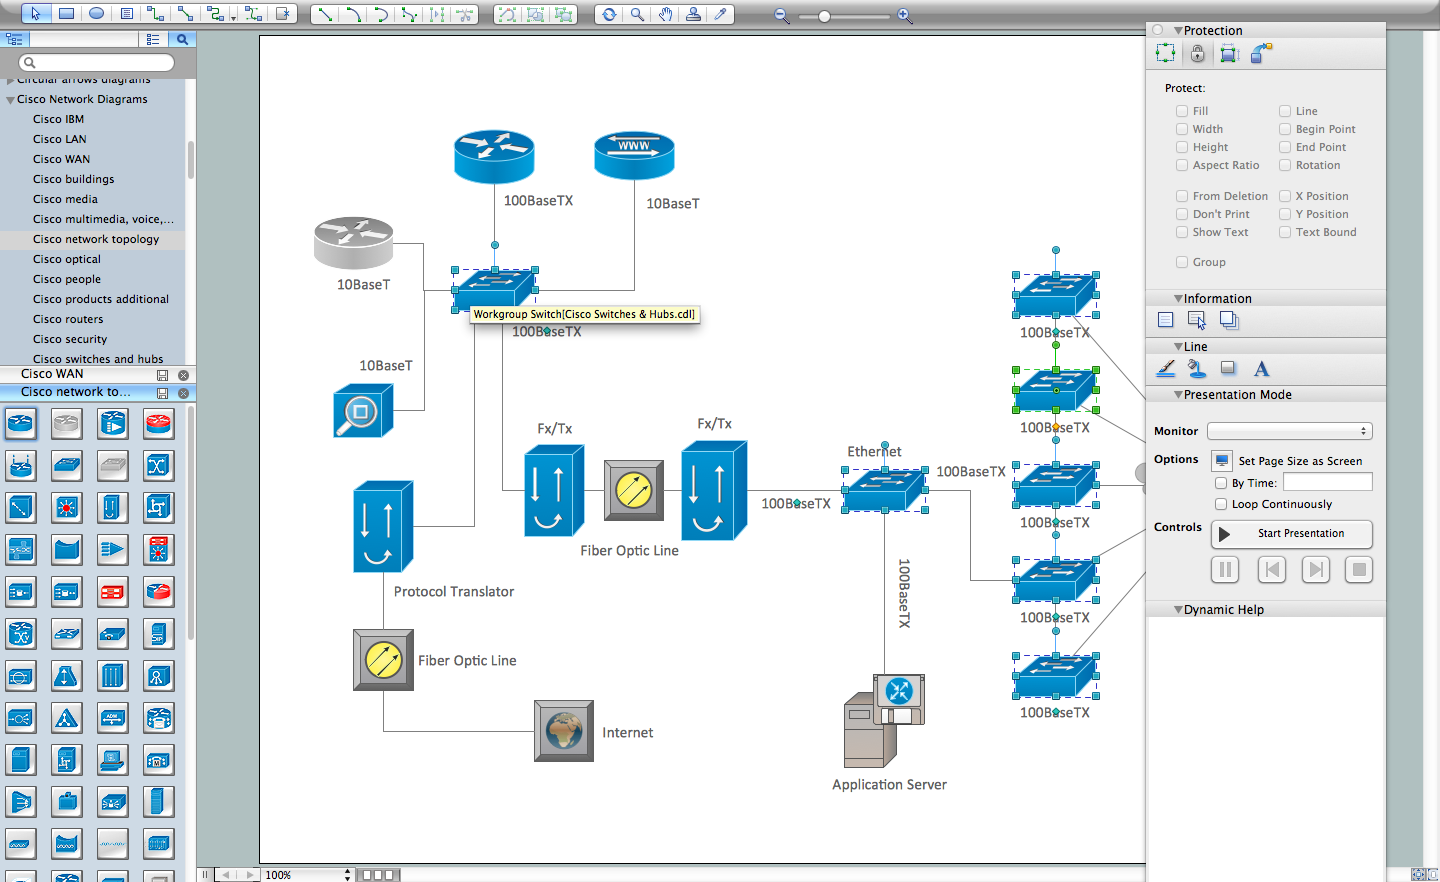
ConceptDraw DIAGRAM is the best network diagram software. To design the Cisco Network Diagrams and visualize the computer networks topology use ConceptDraw DIAGRAM diagramming and vector drawing software extended with Cisco Network Diagrams solution for ConceptDraw DIAGRAM Solution Park.Landscape Architecture with ConceptDraw DIAGRAM
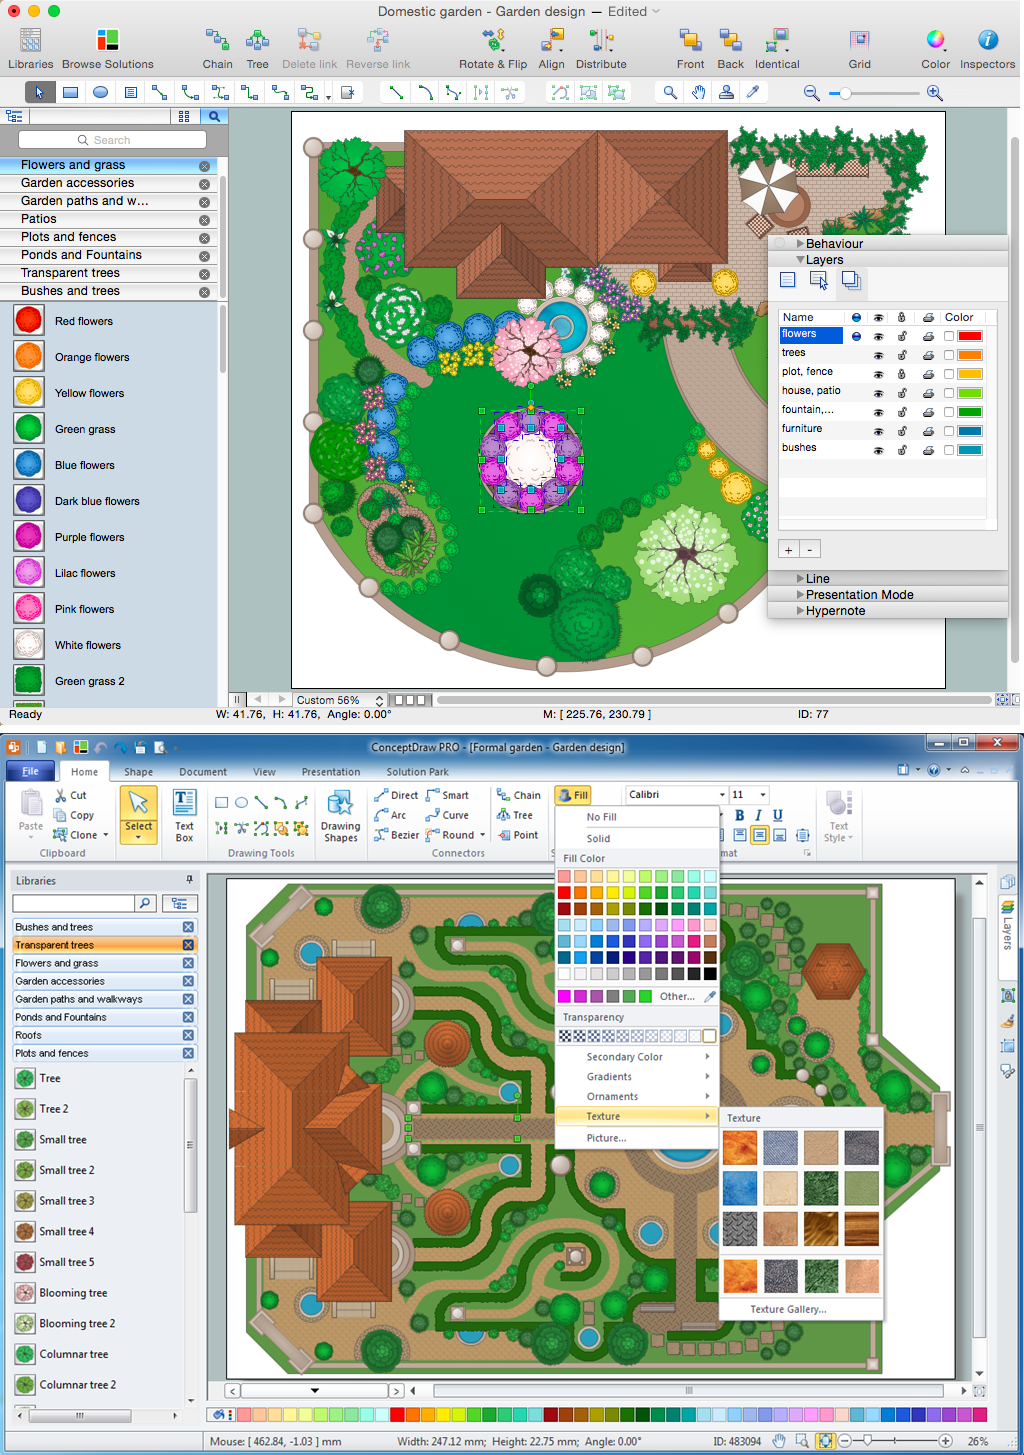
The landscape architecture includes landscape design, planning, and realization, as well as management of resources and buildings. The smaller scale landscape projects are well known as landscape design and garden design. The landscape design documentation is created independently from the project's scale and includes sketches, general plan and working documentation. On this stage the ConceptDraw DIAGRAM software extended with Landscape & Garden solution is irreplaceable assistant for you. The landscape designs created using ConceptDraw DIAGRAM are effectively used by landscape architects and engineers, also by landscape managers who maintain parks, gardens, natural landscapes like woodlands or nature reserves, and artificial landscapes. The Landscape and Garden solution contains 14 libraries with a lot of vector graphics objects of trees, flowers, bushes, fountains, ponds, furniture, roofs, patios, fences, garden accessories, entertainment, roads, junctions, etc., that are suitable for any gardener to simply design a wonderful garden.Flowchart Software
Flowchart is a simple diagram, map or graphical schematic representation the sequence of actions within a process. It is ideal for displaying how a process currently flows or can function ideally. The Flowcharts let define the steps and boundaries of a process, uncover problems or miscommunications. The Flowcharts are widely used in education, software development, business, economics, thanks to their visuality they are ideal for presentations, reports, for using on conferences to help the audience comprehend the content better, or easy find flaws in a process flow diagrams. ConceptDraw DIAGRAM is professional flowcharts software and feature-rich flowchart maker, which supports Mac OS X and Windows. It contains at ConceptDraw Solution Park a rich set of stencils and professional flowchart symbols for design. It lets create simply professional-looking Flowcharts based on thousand free flowchart templates, colored symbols and examples. ConceptDraw DIAGRAM is a 3 times cheaper alternative to MS Visio available for both Mac and PC. It’s is another full featured business and technical diagramming application that can easily take care of Visio files within OS X. Another bonus with ConceptDraw DIAGRAM – it's cross-platform. You can work on a document in both OS X and Windows, skipping Visio entirely.
Site Plan Software
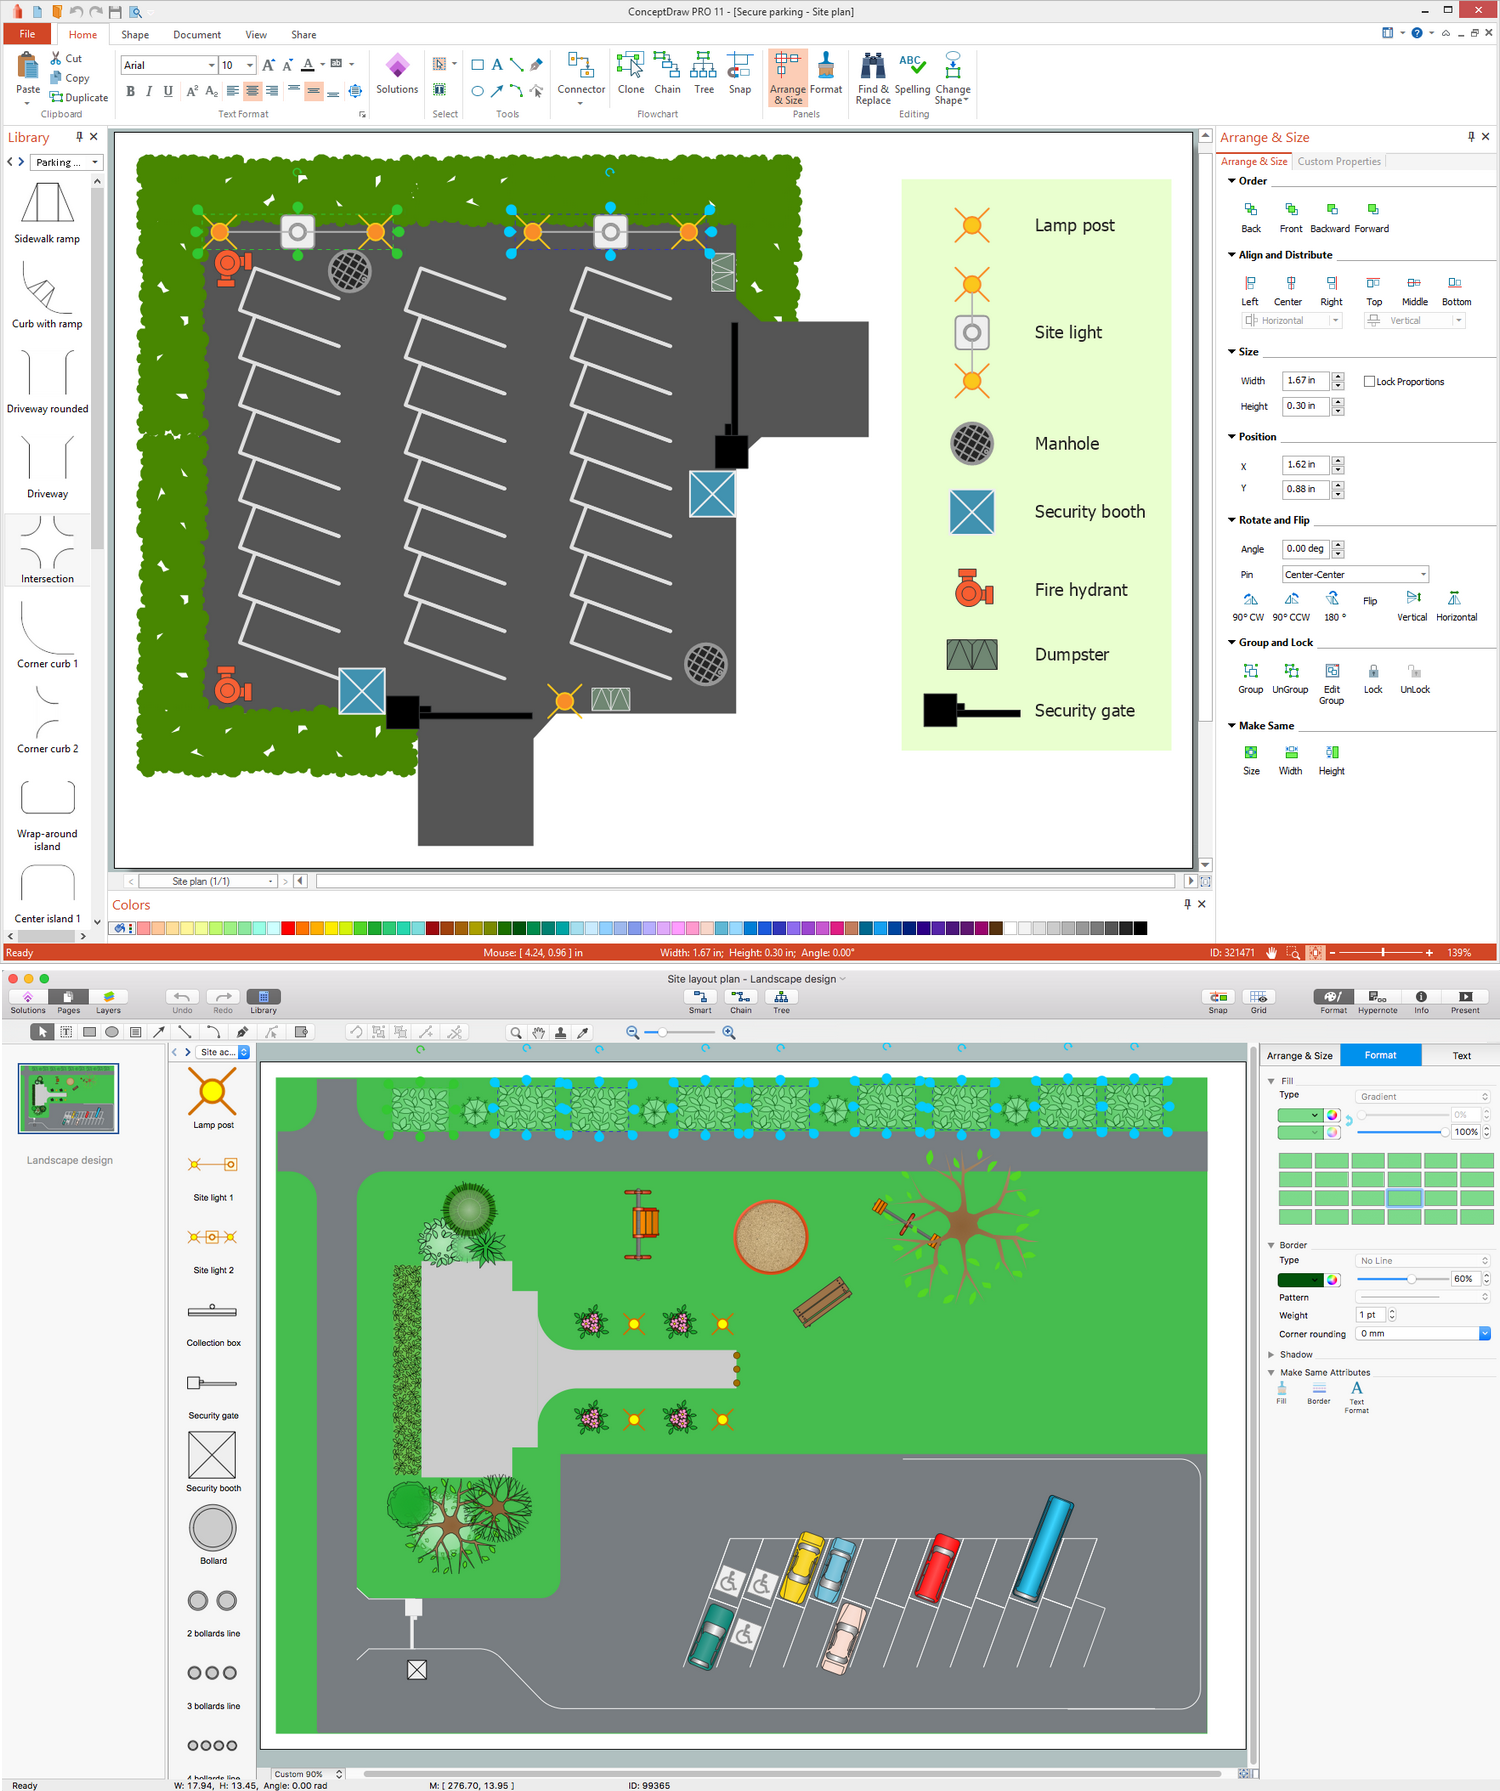
ConceptDraw DIAGRAM diagramming and vector drawing software extended with Site Plans Solution from the Building Plans Area of ConceptDraw Solution Park is a powerful Site Plan Software.Bar Chart Software
The best bar chart software ever is ConceptDraw. ConceptDraw bar chart software provides an interactive bar charting tool and complete set of predesigned bar chart objects.How To Create Restaurant Floor Plan in Minutes
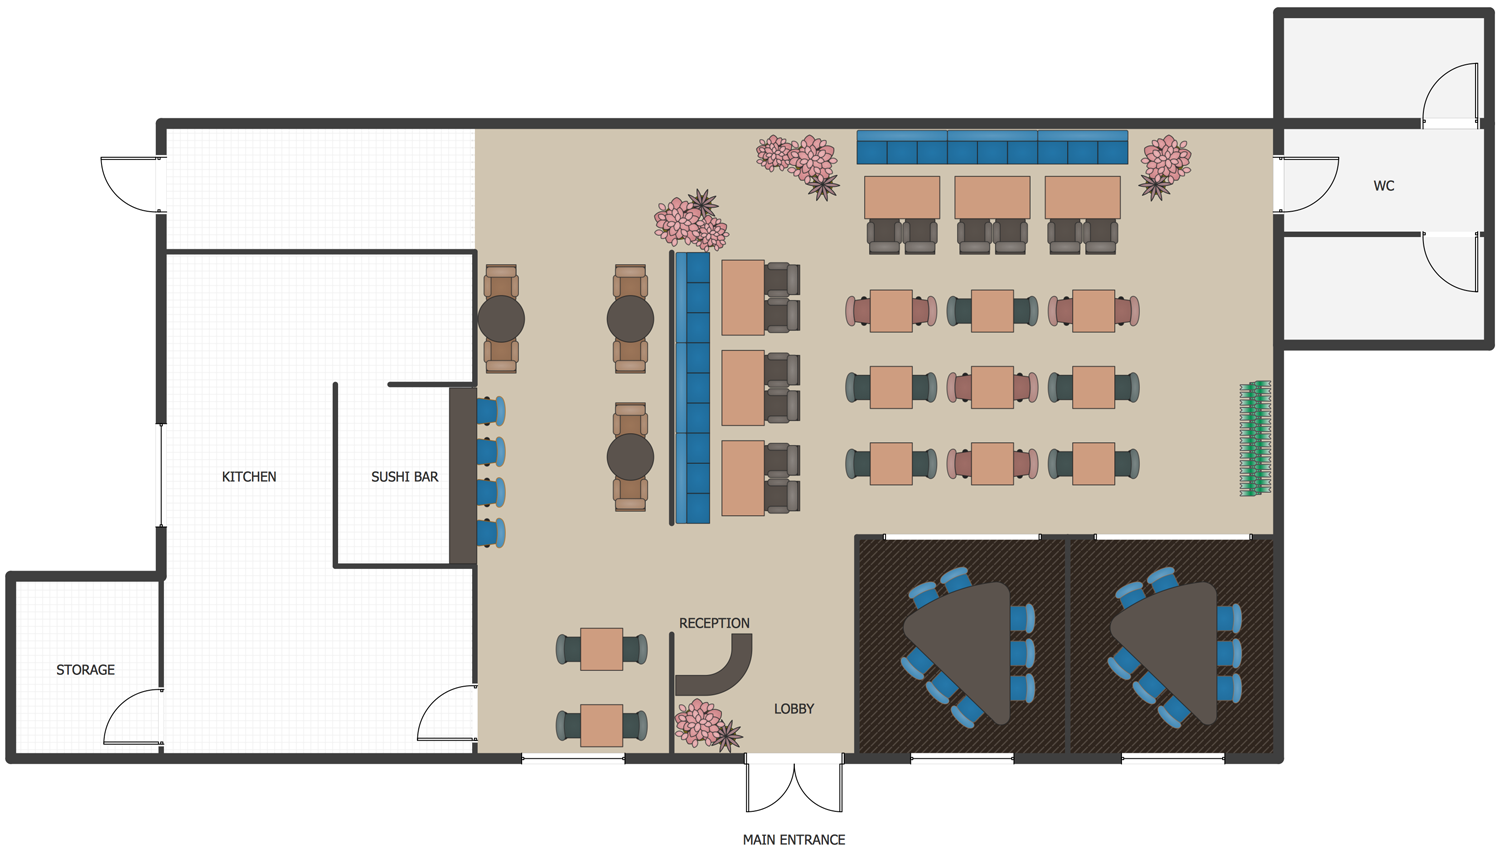
Developing Floor Plans, Design Drawings, Plans of Furniture Placement for restaurants and cafes is one of the most responsible and important steps at their construction and designing. Selection of favorable design, the right style of furniture and decors largely determine the success and atmosphere of the institution. The restaurant floor planner ConceptDraw DIAGRAM is a perfect choice for architects and designers. Enhanced with Cafe and Restaurant Floor Plans solution it offers a lot of extensive vector symbol libraries and building plan elements for drawing Restaurant floor plans, Restaurant layouts, Restaurant furniture layouts, Cafe floor plans, Bar area floor plan, Fast food restaurant plan, etc. With ConceptDraw DIAGRAM you don't need to be an artist to create great-looking restaurant floor plan drawings in minutes, all needed drawing tools are delivered by Building Plans area solutions. Construct your own general plan of restaurant's premises, choose the furniture for your taste from the Cafe and Restaurant Floor Plans solution libraries and arrange it on the plan as you desire fast and easy. ConceptDraw DIAGRAM has many of the features found in Visio for Mac such as Drawing, Connection, Shape and Editing Tools.
Line Graph Charting Software
To design line and scatter charts use ConceptDraw DIAGRAM diagramming and vector drawing software extended with Line Graphs solution from Graphs and Charts area of ConceptDraw DIAGRAM Solution Park. (Line chart, scatter chart, 2d chart).Sign Making Software
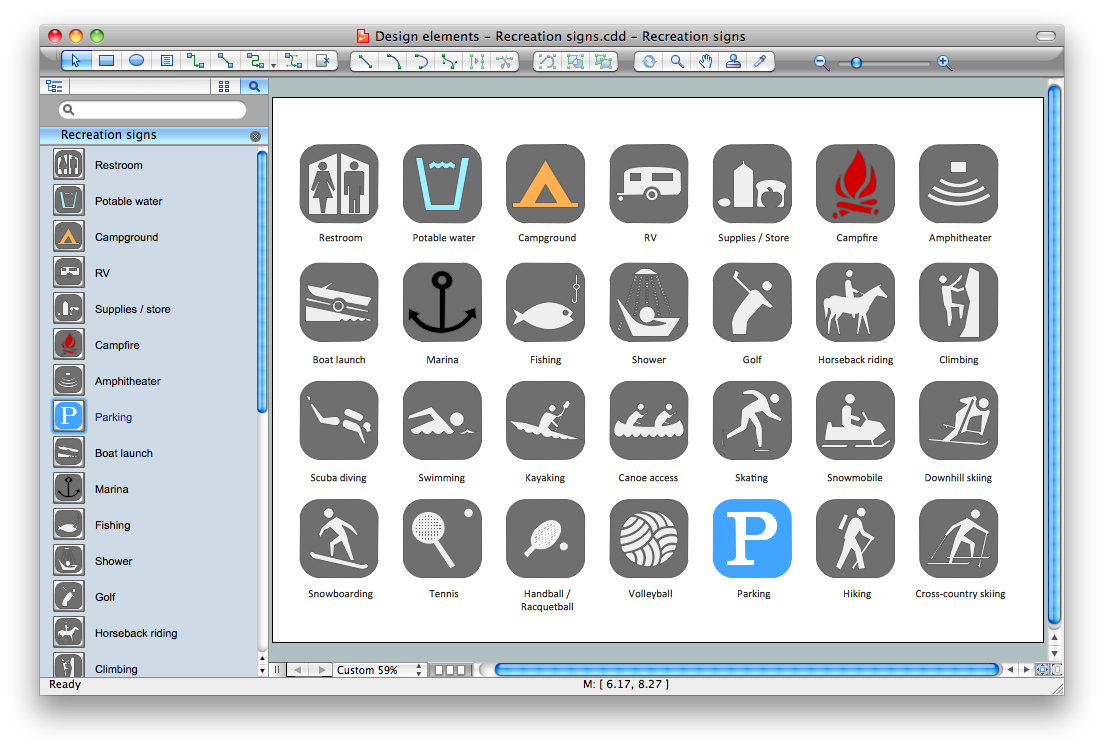
ConceptDraw DIAGRAM is a powerful sign making software thanks to the vector stencils library "Recreation signs". This library is included in the Directional Maps solution from the Maps area of ConceptDraw Solution Park. Sign making software is very useful tool for professional sign-making business. Use ConceptDraw DIAGRAM and make sure that now sign making is easier and timesaving than ever!Diagram Software - The Best Choice for Diagramming
For vector shapes and connector tools for quick and easy drawing diagrams for business, technology, science and education - The best choice for Diagramming is ConceptDraw DIAGRAM.Flowchart Software
The Flowcharts are popular and widely used for designing, documenting, managing and analyzing the complex processes and programs in various fields, such as science, business, engineering, architecture, manufacturing, administration, and many others. To design professional looking Flowchart Diagrams we recommend to use the ConceptDraw DIAGRAM diagramming and vector drawing software extended with set of Flowchart maker solutions from the Diagrams, Finance and Accounting, Marketing, and Business Processes areas of ConceptDraw Solution Park. ConceptDraw DIAGRAM flowchart software is rich for the libraries of ready-to-use predesigned vector flowchart objects, templates, samples and examples, which make it the best choice for designing the Flowcharts of any type and style. Besides, the ConceptDraw documents with Flowchart Diagrams are vector graphic documents, available for reviewing, modifying and converting to different popular formats: image, HTML, PDF file, MS PowerPoint Presentation, Adobe Flash or MS Visio XML.Technical Drawing Software
Technical drawing or draft is a form of specialized graphic communication, exchange of ideas in industry and engineering. It is a visual representation of object with indication of dimensions and used material, constructed with maintaining the proportions between its parts. Technical drawings are constructed by architects, technologists, engineers, designers, drafters, and other technical professionals according to defined rules, specifications, internationally accepted standards and standardized notations allowing to make unambiguous, clear and understandable technical drawings. ConceptDraw DIAGRAM extended with Electrical Engineering solution, Mechanical Engineering solution, Chemical and Process Engineering solution from Industrial Engineering Area of ConceptDraw Solution Park is ideal technical drawing software. Its powerful drawing tools, predesigned vector objects, templates, samples are helpful for creation all kinds of Technical Drawings and Technical Diagrams, Electrical and Mechanical Schematics, Circuit and Wiring Diagrams, Structural Drawings, and many other.Best Vector Drawing Application for Mac OS X
ConceptDraw DIAGRAM creates drawings, diagrams and charts with great visual appeal in Mac OS X.Basic Diagramming
Create flowcharts, organizational charts, bar charts, line graphs, and more with ConceptDraw DIAGRAM.
The Best Flowchart Software Available
ConceptDraw gives the ability to draw Flowchart documents. Flowcharts solutionis a powerful tool that extends ConceptDraw application for drawing business flowcharts. ConceptDraw DIAGRAM ector diagramming and business graphics software enhanced with with templates, green and interactive flowchart makers, samples and stencil libraries from ConceptDraw Solution Park which all focused to help with drawing flowcharts, block diagrams, bar charts, histograms, pie charts, divided bar diagrams, line graphs, area charts, scatter plots, circular arrows diagrams, Venn diagrams, bubble diagrams, concept maps, and others.
Process Flow Chart Software Free
How to draw a Process Flow Chart? It's very fast and easy to draw any Process Flow Chart using the tools of special Process Flow Chart software free. Flowcharts Solution offers wide set of useful drawing tools, collection of samples, ready-to-use template and 2 libraries with predesigned vector elements which will help facilitate drawing process and designing professional looking process flow chart, process flow scheme, process block diagram, etc.Basic Diagramming Flowchart Software
ConceptDraw DIAGRAM is a powerful intelligent vector graphics tool for drawing flowcharts.Basic Diagramming
Try ConceptDraw program, the perfect drawing tool for creating all kinds of great-looking drawings, charts, graphs, and illustrations.
Spider Chart Template
This sample shows the Spider Chart that represents the budget and spending for one organization and allows to compare them. The multivariate data are represented on the Spider Chart as a two-dimensional chart with four or more variables displayed on the axes that start in one point. The Spider Charts are used in the management, business and sport.Pie Chart
ConceptDraw DIAGRAM diagramming and vector drawing software offers the Pie Charts solution from the Graphs and Charts area of ConceptDraw Solution Park for quick and easy drawing the Pie Chart of any complexity.- Flowchart Software | Diagramming Software for Design UML Activity ...
- Chemical and Process Engineering | Technical Drawing Software ...
- Entity Relationship Diagram Software Free Download
- Flowchart Software | ConceptDraw DIAGRAM The best Business ...
- ConceptDraw Software Full Versions Free Download | Rack ...
- Physics Diagrams | Physics Symbols | Basic Diagramming Flowchart ...
- Plant Layout Plans | Top 10 Graphic Design Software
- Venn Diagram Template | Venn Diagrams | Venn Diagram ...
- Chemical Plant Design Software Free Download
- Free Electrical Drawing Program For Mac
- ConceptDraw Software Full Versions Free Download | Concept ...
- Infographic Maker | Flowchart Software Free Download | Map ...
- ConceptDraw PROJECT Project Management Software Tool ...
- | | The Best Flowchart Software Available | Flow Chart Design App ...
- Best Flowchart Software and Flowchart Symbols | The Best ...
- Best Vector Drawing Application for Mac OS X | Venn Diagram ...
- | Free Graphic Software Online
- Flowchart Program Mac | Flowchart Software | Create Flow Chart on ...
- Plumbing and Piping Plans | Plumbing Design Software Free ...
- Biology Drawing Software | Basic Diagramming Flowchart Software ...

