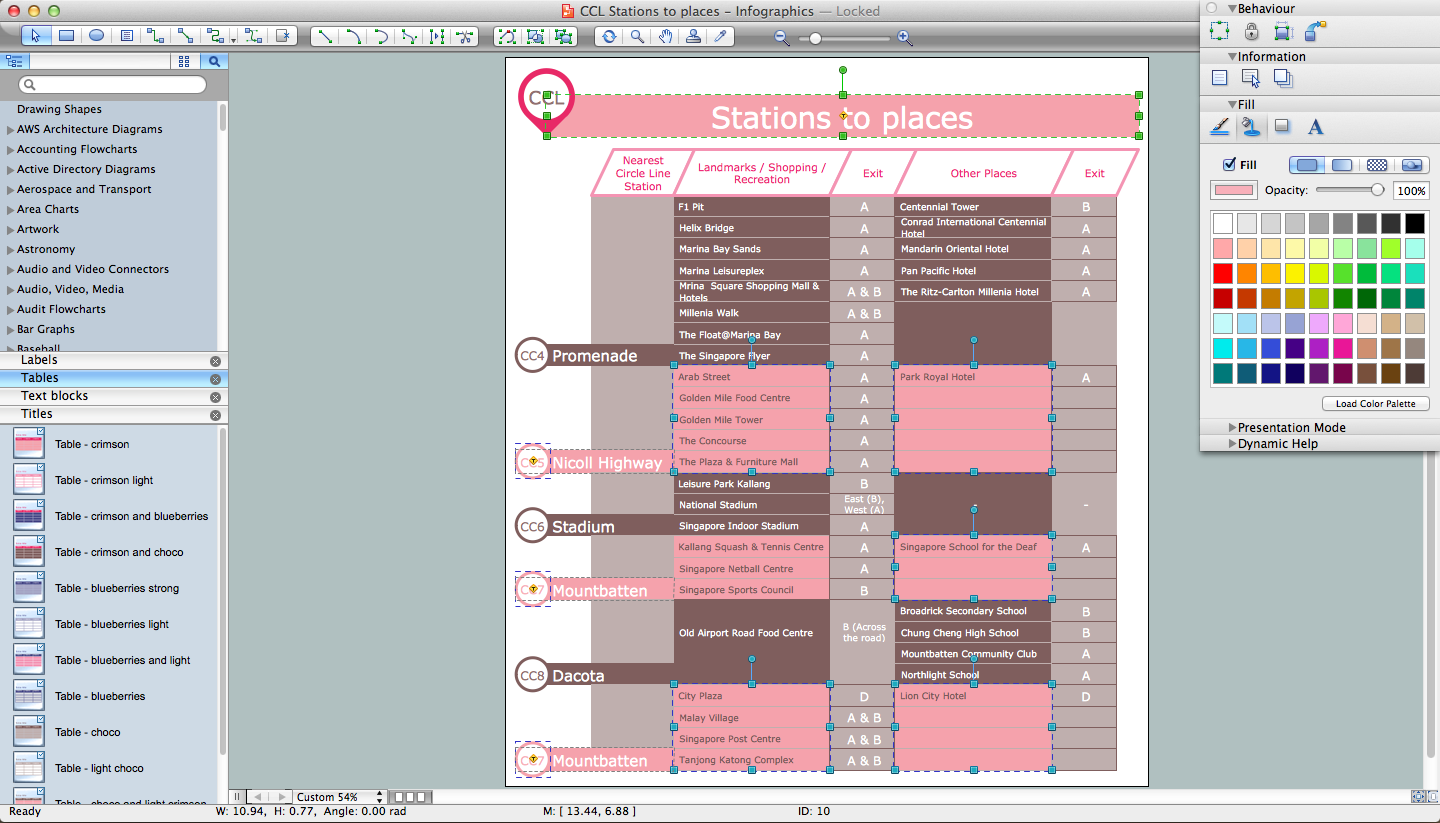
Best Tool for Infographic Construction
ConceptDraw is a best data visualization tool that will allow everyone to create rich infographics and visualizations quickly and easily.Typography Infographic Software
ConceptDraw DIAGRAM supplied with Typography Infographics Solution from the “Infographics” Area is a powerful typography infographic software that provides a set of useful typography infographics tools. Use the Typography Infographics Solution for ConceptDraw DIAGRAM typography infographic software to create your own professional looking Typography Infographics of any complexity quick, easy and effective, and then successfully use them in various fields.Subway infographic design elements - software tools
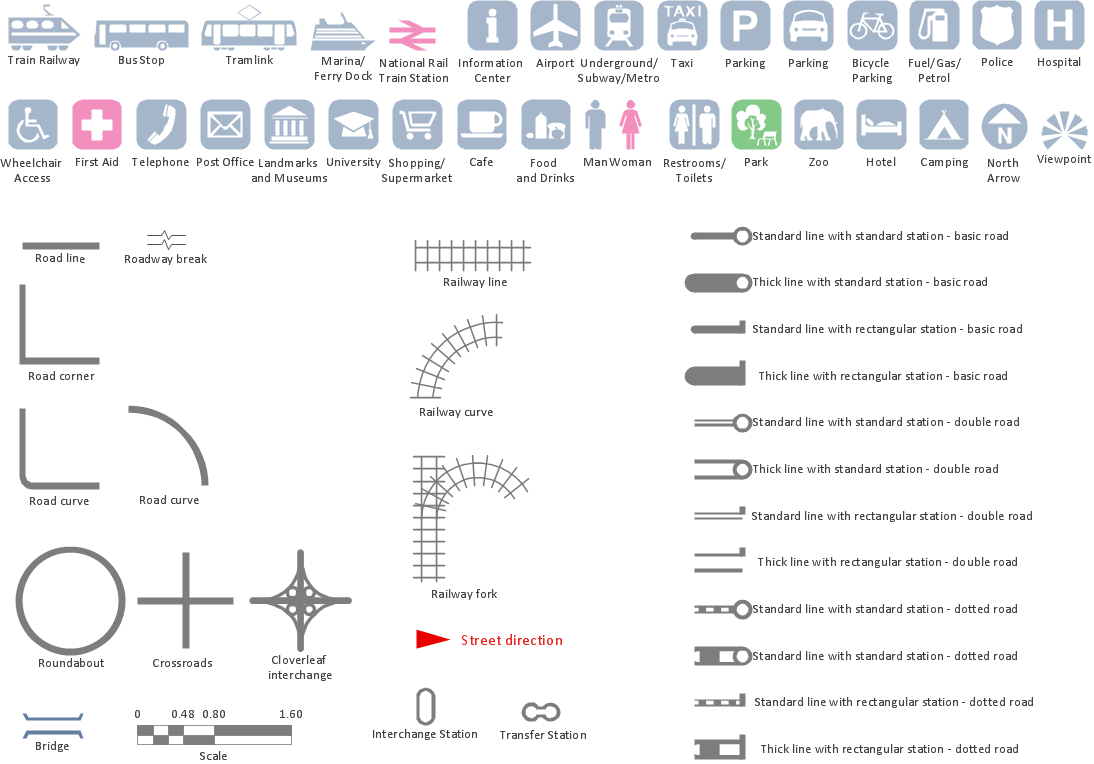
Subway infographic design elements of MetroMap and ConceptDraw software tools.Map Infographic Creator
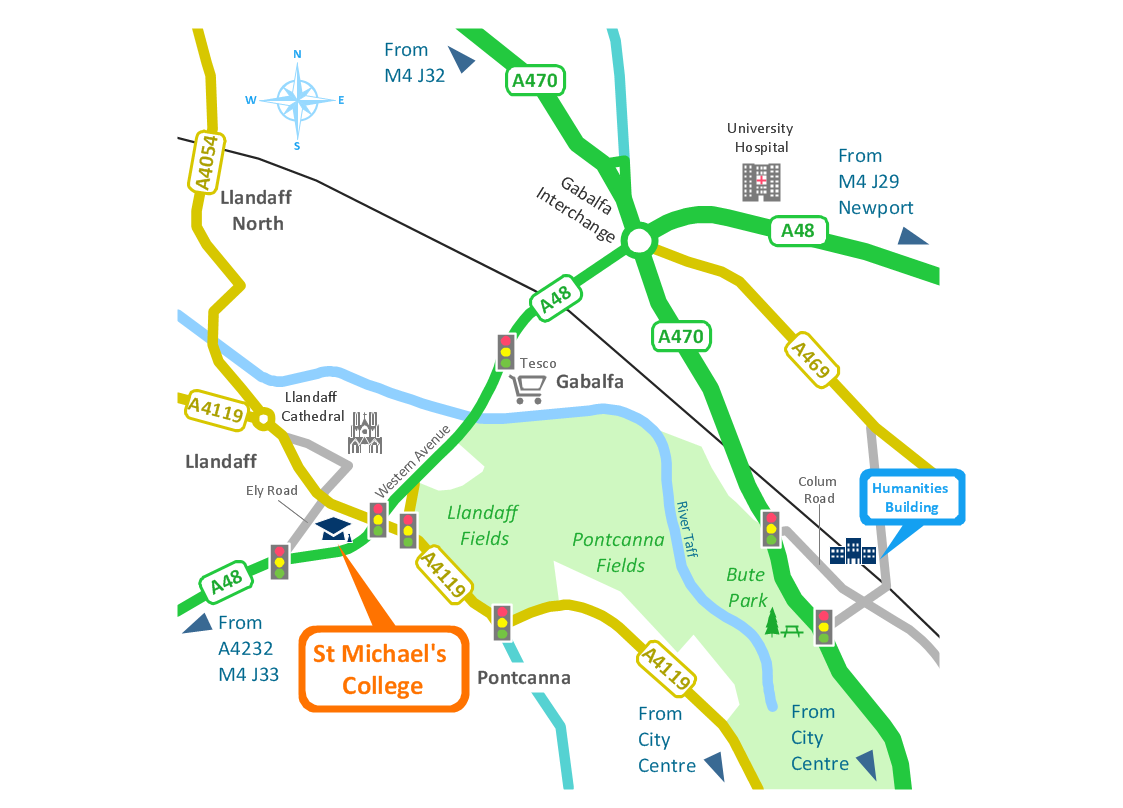
Follow samples and map templates to create nfographic maps. It's super-easy!Agriculture Infographic
Use the Agriculture Infographics solution to create multifarious visuals, agriculture and farm graphics, infographics, illustrations, and diagrams illustrating the efficiency of various farming methods and principles of organic farming promoting soil and environment health, and biodiversity. Show the allocation of various crops and livestock worldwide, major crops produced in various regions, the flow of agricultural products between countries, application of smart technologies or data analytics tools, global supply chains, major exporters and importers, and outline key governmental policies in the agriculture field. Highlight productivity differences and compare crop yields across different countries or continents, indicate climate factors that affect crop yields, show global production patterns, trade dynamics, market trends, regional agricultural strengths and challenges, investment opportunities, and economic impacts. Present insights into how innovations can enhance productivity and sustainability in farming, reduce pollution, and enhance ecosystem health.Infographic Maker
Infographic is a visual way of representing various information, data, knowledge in statistics, geography, journalism, education, and much more areas. ConceptDraw DIAGRAM supplied with Pictorial Infographics Solution from the “Infographics” Area, provides a set of powerful pictorial infographics tools. Thanks to them it is the best Infographic Maker.Infographic Generator
ConceptDraw DIAGRAM extended with Typography Infographics Solution from the “Infographics” Area is the best Infographic Generator. Make sure in it right now! Typography Infographics Solution offers you the best numerous collection of predesigned infographics examples and 9 libraries with large quantity of ready-to-use vector stencils that will help you design your own Typography Infographics of any complexity in minutes..Spatial infographics Design Elements: Location Map
Infographic Design Elements for visually present various geographically distributed information.Tools to Create Your Own Infographics
Over the past few centuries, data visualization has evolved so much that we use it every day in all areas of our lives. Many believe that infographic is an effective tool of storytelling, as well as analytics, and that it is able to overcome most of the language and educational barriers. Understanding the mechanisms of human perception will help you to understand how abstract forms and colors used in data visualization can transmit information more efficient than long paragraphs of text.Infographic Tools
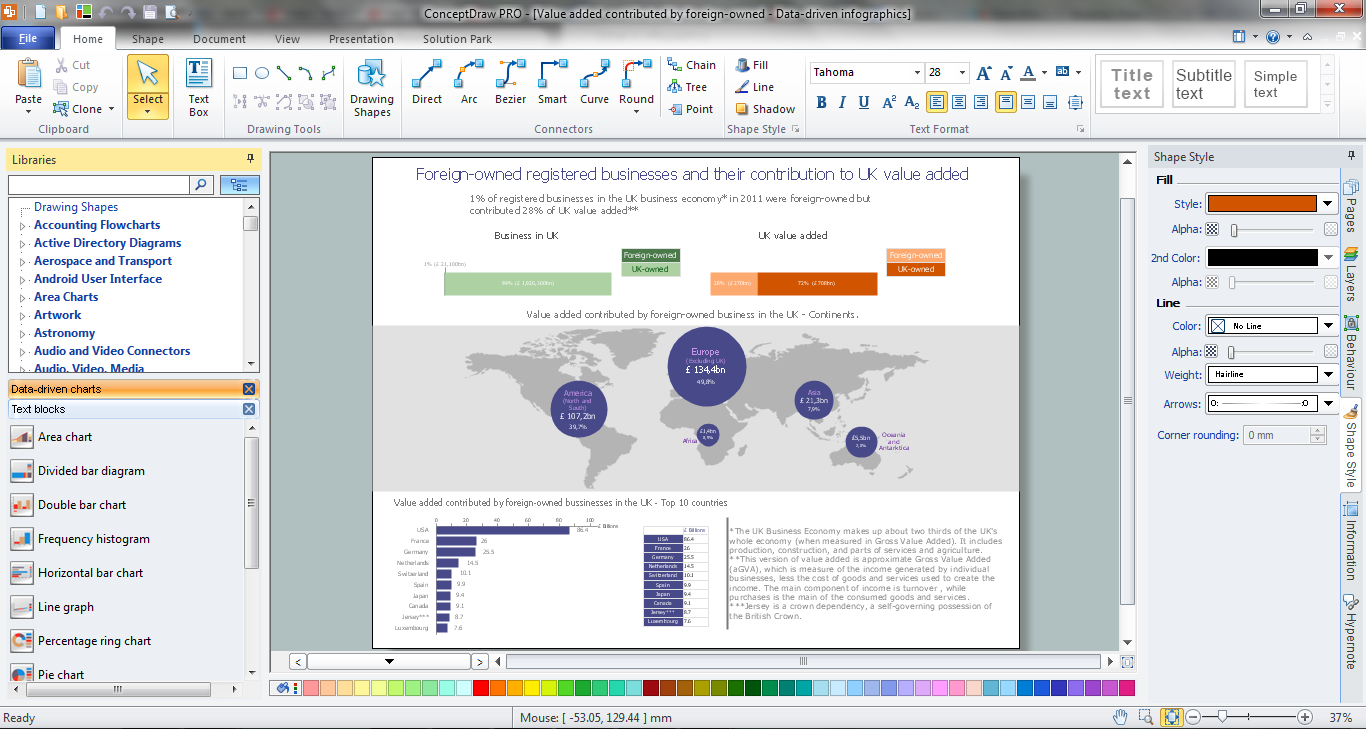
ConceptDraw DIAGRAM diagramming and vector drawing software offers the best infographic tools - Data-driven Infographics Solution from the “Infographics” Area of ConceptDraw Solution Park.Design Pictorial Infographics. Design Infographics
In the course of recent decades data visualization went through significant development and has become an indispensable tool of journalism, business intelligence and science. The way visual information may be conveyed is not limited simply to static or dynamic representation, it can also be interactive. Infographics can be conditionally divided into several general levels. Primarily, this is level of visualization of information, its interpretation and association on any ground. Second level can be defined as a visualization of knowledge, depiction of thoughts and ideas in the form of images or diagrams. Finally, the level of data visualization, which processes data arrays in charts, enabling the information to be more clearly perceived. You can also identify the main approaches to the creation of infographics: exploratory and narrative. Exploratory method insists on minimalist design in favor of data precision without unnecessary details and is common for scientific researches and anaPie Graph Worksheets
Pie Graph is very popular kind of charts which is widely used in various fields of science and life activities. ConceptDraw DIAGRAM extended with Pie Charts Solution from the Graphs and Charts area is the best software for drawing the Pie Graph Worksheets.Excellent Examples of Infographic Maps
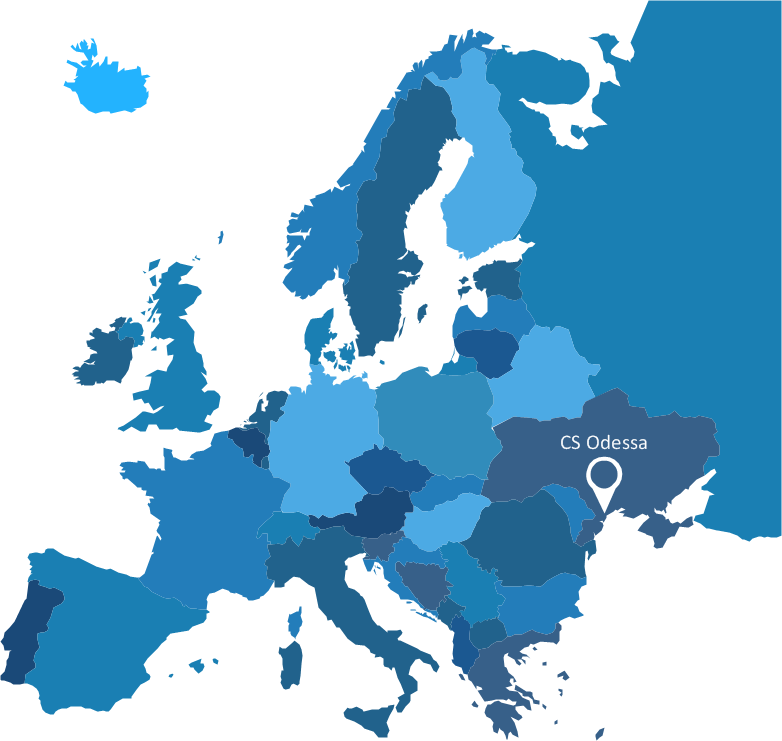
Create Spatial infographics with ConceptDraw using its excellent examples of infographic maps. We hope these can inspire and teach you!Cross-Functional Flowchart (Swim Lanes)
Cross-Functional Flowchart is a type of chart which shows the series of process steps connected by the arrows to depict their order and applies the swim lanes to provide an extra dimension with means of assigning each process step to certain category. Often the category or the functional unit is a stakeholder (department, person, role), resource, project, phase, or any other attribute. Cross-Functional Flowcharts visually illustrate relationships between the business processes and the functional units responsible for this processes. ConceptDraw DIAGRAM is a powerful diagramming and vector drawing software for professional design Cross-Functional Flowcharts using the common notation of shapes and swim lanes. Cross-Functional Flowcharts solution included to the Business Processes area of ConceptDraw Solution Park provides numerous well-designed vector objects and connector tools for quick, easy and effective organizing information, representing process flows and relationships, and drawing Cross-Functional Flowcharts for business, science, education, technology, etc.Map Infographic Maker
Take inspiration with ConceptDraw to visualise your maps and make eye-catching infographics.Travel Infographics
Travel Infographics solution greatly extends the ConceptDraw DIAGRAM functionality making it the best travel infographics design software. Being intended for all specialists in the travel sphere, travel agents, marketers, advertisers, PR specialists, travelers and all other people related with tourism and rest, it contains professionally-designed samples, travel infographics template, and libraries with large variety of ready-made travel infographic vector clipart, design objects and travel infographics icons for drawing exceptional travel infographics and business travel infographics, travel illustrations, presentations, diagrams, schematics, plans, maps, posters, billboards, advertising, marketing, and other materials on the subject of travel and tourism, outdoor activities and extreme sports.
Onion Diagram as Stakeholder Mapping Tool
Stakeholders are the groups of people or organizations whose contribution matters to the organization's success, this can be labour participation, financial participation, dissemination of information about organization, etc. So, the employees of the company, its suppliers, customers, media, public organizations, state authorities, all they are stakeholders of the company. ConceptDraw DIAGRAM diagramming and vector drawing software extended with Stakeholder Onion Diagrams Solution from the Management Area of ConceptDraw Solution Park is a powerful stakeholder mapping tool which allows easy create Stakeholder Onion diagrams and maps depicting the layers of a project, relationships of stakeholders to a project goal, and relationships between stakeholders.How To Create Home Plan with Examples
How to build the home of your dream? All begins from the design and drawing a basic home building plan and the set of attendant plans on its base. Visualization of your ideas in form of plan is the best explanation of expected result and requirements for a building team. If you are an architect and perform a building project on request, the plan is the main and only way to present your work for a client. Home plan is also required during repairing or remodeling of the home. The use of special architectural or design software is incredibly convenient to fully plunge to creativity and easily draw professional-looking Home plans. ConceptDraw DIAGRAM diagramming and vector drawing software enhanced with Floor Plans solution is exactly what you need. It contains a lot of built-in drawing tools, numerous examples, quick-start templates and predesigned vector objects and clipart helping you create great-looking home designs. Among them are the predesigned objects of walls, windows, doors, different furniture, appliances, sanitary equipment, decor elements, plants, and many others.- Best Tool for Infographic Construction | How to draw Metro Map style ...
- Best Tool for Infographic Construction | Spatial infographics Design ...
- Infographic Software | Subway infographic design elements
- Subway infographic design elements - software tools | Map ...
- Infographic Tools | ConceptDraw Solution Park | Best Tool for ...
- How to Create Data-driven Infographics | Best Tool for Infographic ...
- Spatial infographics Design Elements: Continental Map | Map ...
- Subway infographic design elements - software tools | Infographic ...
- Spatial Infographics | Map Infographic Creator | Map Infographic Tool